How to Connect the pgEdge AI DBA Workbench to Supabase for Intelligent Monitoring
If you’re using Supabase to power your applications, you've likely already needed deeper visibility, anomaly detection, or alerts that go beyond what a dashboard can give you.
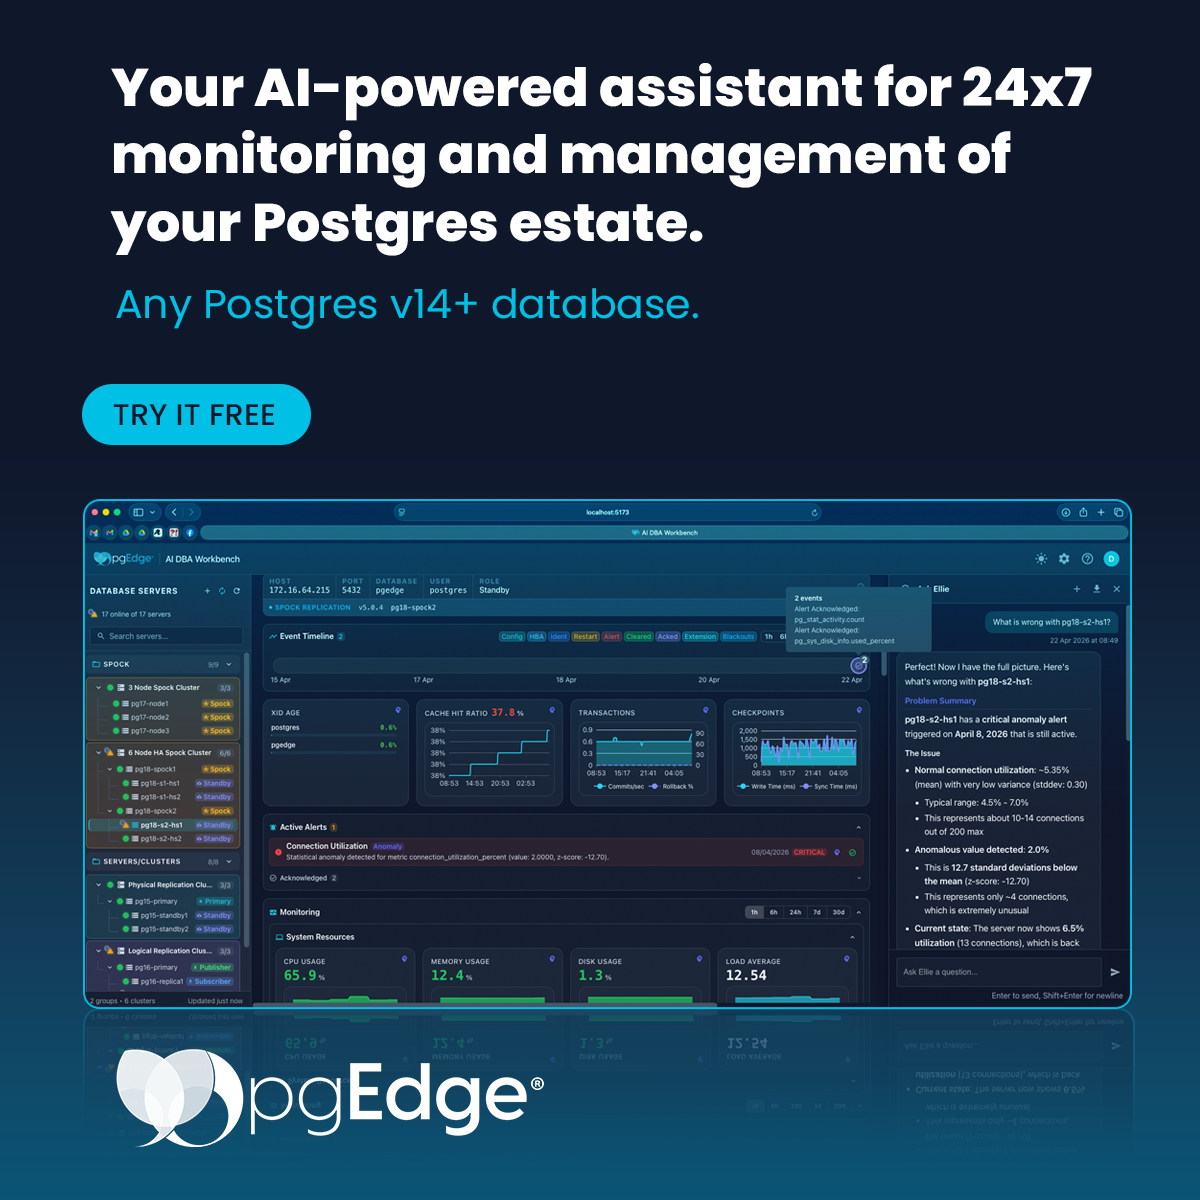
This is where the pgEdge AI DBA Workbench comes in: a 100% open source (under the PostgreSQL license) unified environment for monitoring and management of any PostgreSQL v14+ instance, including Supabase, Amazon RDS, Google Cloud SQL, and self-managed. A data collector is combined with alert monitoring and a web dashboard (with an optional natural chat language interface) for advanced metric tracking. 34 probes are run continuously against PostgreSQL system views, tracking connections, replication lag, locks, vacuum activity, WAL, and query stats over time. Every metric lands in a Postgres datastore you own and control, with one dashboard for the whole stack that includes metric history that follows each database across deployments.
That historical data is what makes the difference. The Workbench detects anomalies by building statistical baselines, comparing patterns against known signatures, while using an LLM to classify signals that don’t fit. You get alerts grounded in your actual performance history, not just a snapshot of right now. The chat interface works the same way. When you ask a question, you’re querying your collected metrics over time. That means you can ask things like “why did query latency spike last Tuesday?” and get an answer backed by real data.
Ellie, the chat assistant, also remembers context across conversations. Pin facts about your environment once ('our busy period is 2-4pm EST', 'this cluster hosts customer-facing workloads only') and they ride along in every future investigation. Memories are stored as embeddings in the same Postgres datastore as your metrics, and you can review or delete them at any time.
Cloud-connected LLMs such as Claude, OpenAI, and Gemini are supported in addition to locally hosted models like Ollama for air-gapped environments.
If you’re thinking about giving the Workbench a try against your Supabase clusters, you’re in the right place. In this guide, we’ll walk through exactly how to set up the connection step-by-step.
Note: Extensions like system_stats and spock are not supported on Supabase, but the AI DBA Workbench can still extract vital performance and health metrics using standard PostgreSQL connectivity.
Prerequisites
Before we start, ensure you have both sides of the equation ready.
1. Set Up the AI DBA Workbench
Ensure that your AI DBA Workbench environment is installed, configured, and running. The Collector, DBA Server, and Alerter configurations should be trained for the AI DBA Workbench control database, and the required services must be active. If you’re running on a Linux host, start them with the following commands:
Note: This guide assumes installation via the (open source, and free to download) pgEdge Enterprise repository. Alternative setups, such as Docker-based deployments, follow a different configuration process and are not covered in this guide.
systemctl start pgedge-ai-dba-collector.service
systemctl start pgedge-ai-dba-server.service
systemctl start pgedge-ai-dba-alerter.service

# Update SELinux policy to allow Nginx to bind to port 8444
semanage port -a -t http_port_t -p tcp 8444

# Start the nginx Service
systemctl start nginx.service
Use the following commands to create a Workbench Superuser with admin privileges to add new servers:
cd /usr/bin
./ai-dba-server -add-user -username admin -data-dir /var/lib/pgedge/ai-dba-server/
./ai-dba-server -set-superuser -username admin -data-dir /var/lib/pgedge/ai-dba-server/
# Output: User 'admin' is now a superuser
2. Prepare Your Supabase Project
Sign in to Supabase and either open an existing project or create a new one.
Make sure you know the password for the postgres user.
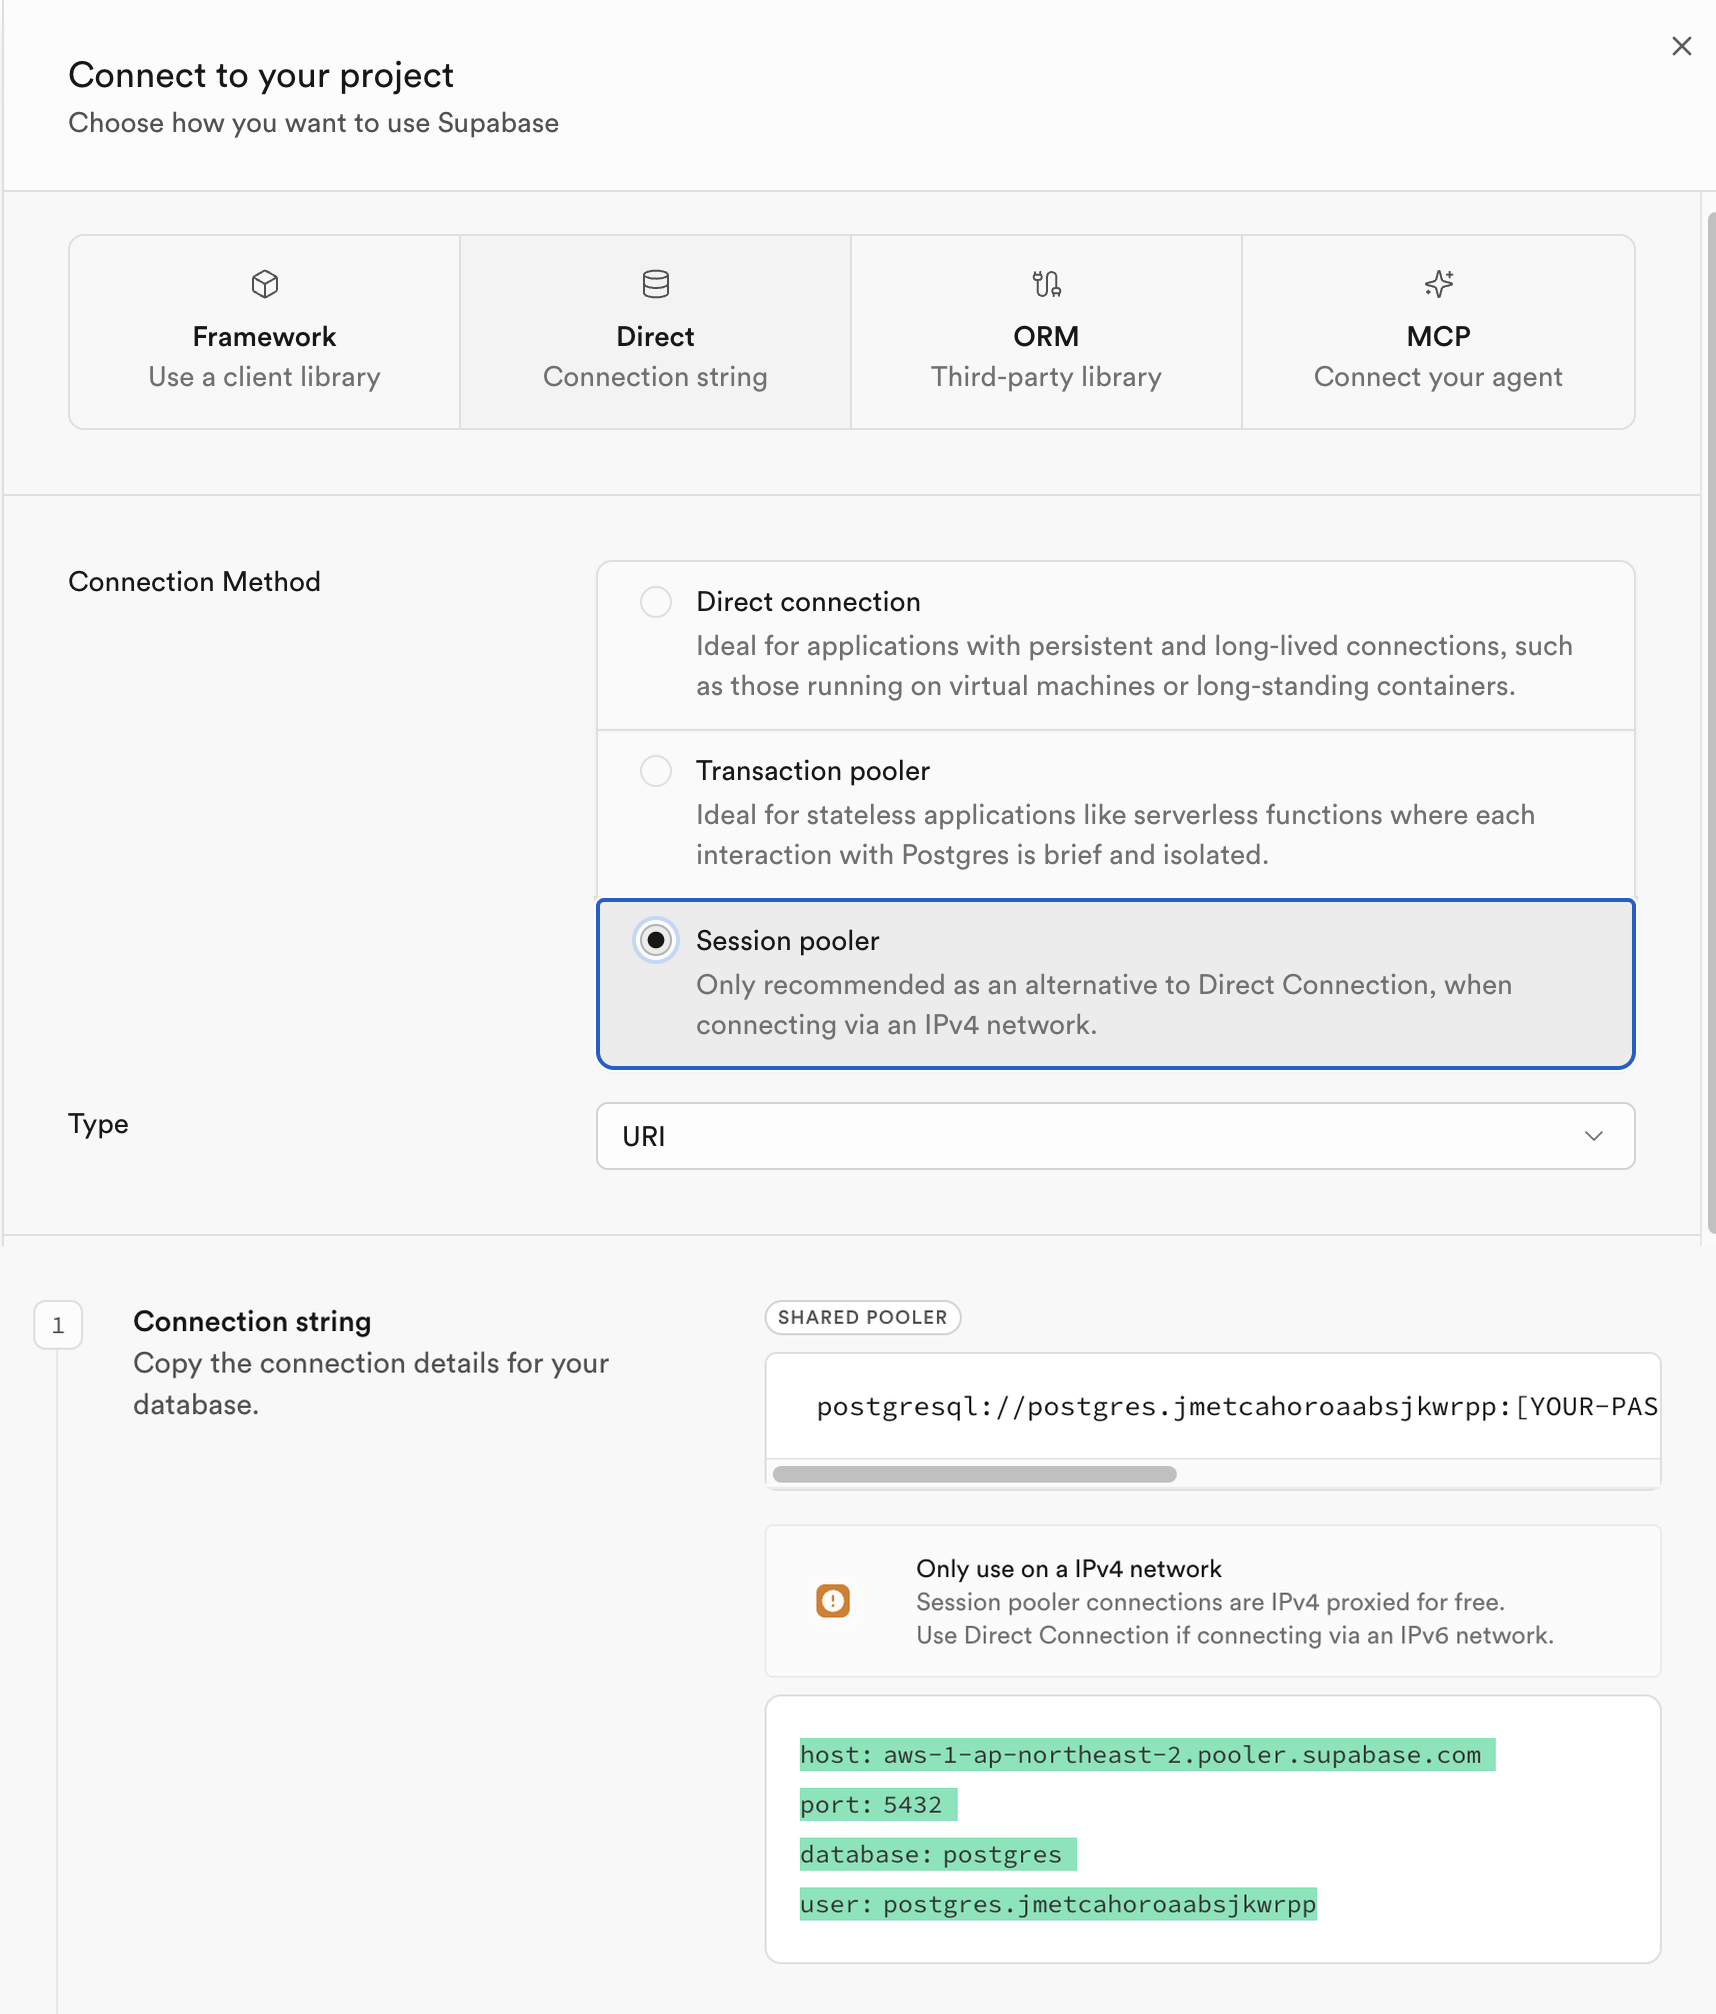
In your Supabase dashboard, navigate to the Database Settings and select the Session Pooler option to view your connectivity details. Keep this connection string handy.
Step-by-Step Guide: Adding Supabase to the Workbench
Step 1: Log In to the AI DBA Workbench
1. Launch the AI DBA Workbench web GUI (typically available at http://localhost:8444/).
2. Log in using the admin user credentials you created during the prerequisite steps.
Step 2: Add a Server Group
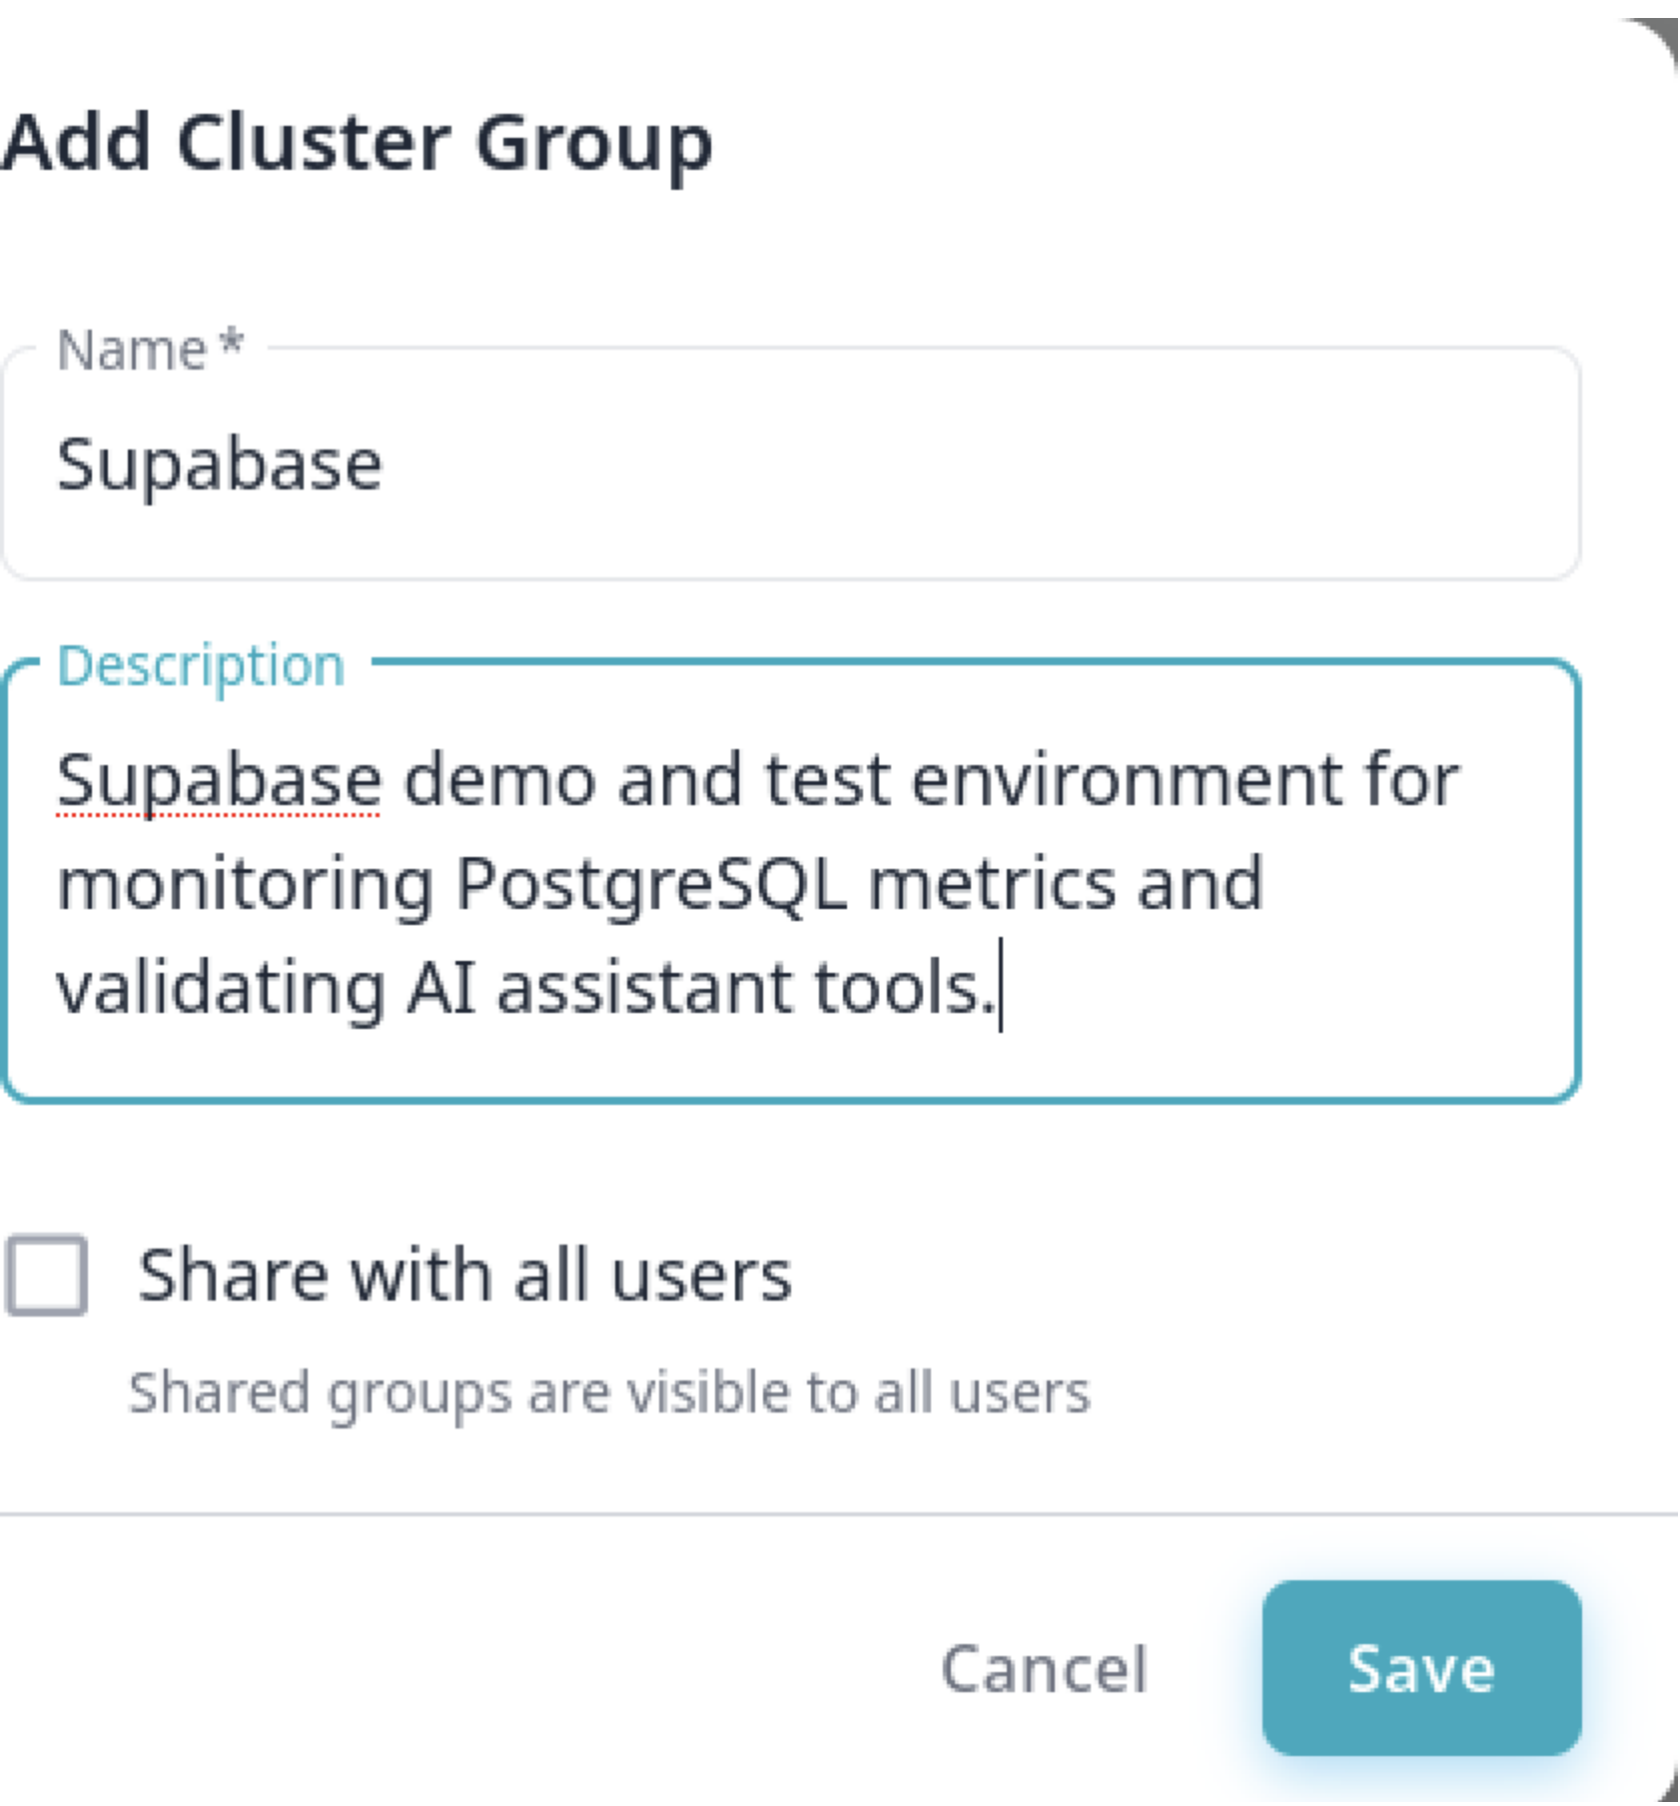
Organizing your servers into groups keeps your Workbench workspace clean and easy to navigate. We’ll create a dedicated group named Supabase for this connection.
Navigate to Clusters in the left-hand navigation panel of the web UI.
Click New Group to open the group creation dialog.
Enter the group name: Supabase.
Click Save to confirm.
Step 3: Add a Cluster
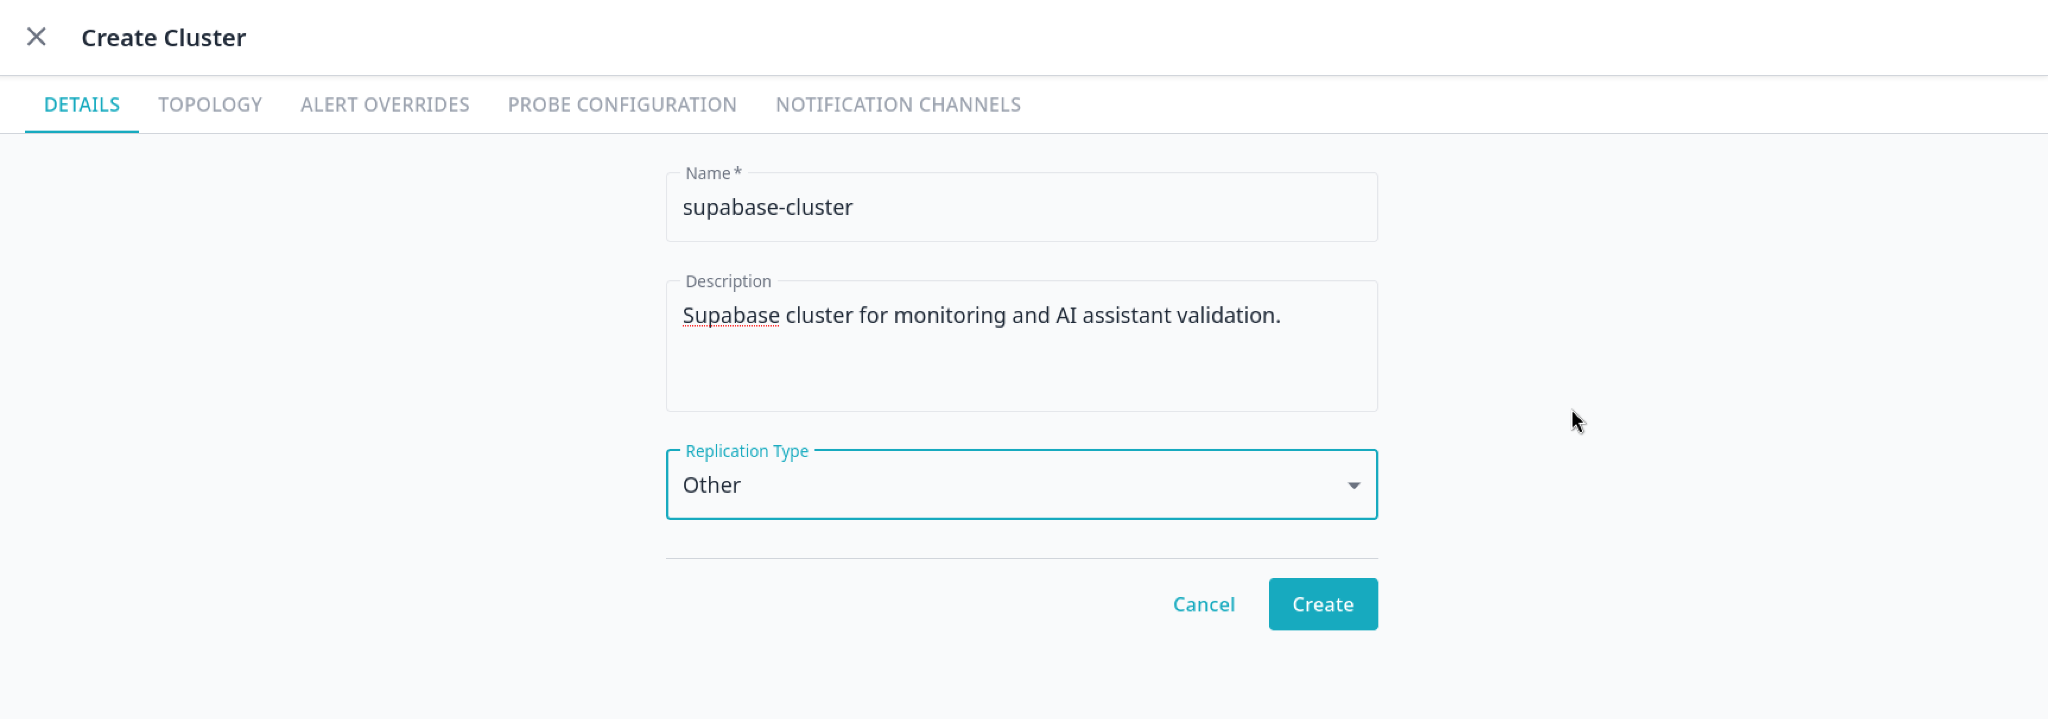
Inside the newly created Supabase group, click New Cluster.
Fill in the cluster details:
o Name: supabase-cluster
o Replication Type: Other (Since Supabase manages its replication internally)
Click Save.
In the cluster navigator panel, drag the new cluster and drop it into the Supabase group.
Step 4: Add Supabase as a Server
Next, we link the Supabase database to the Workbench. This step registers your Supabase instance as a monitored server node.
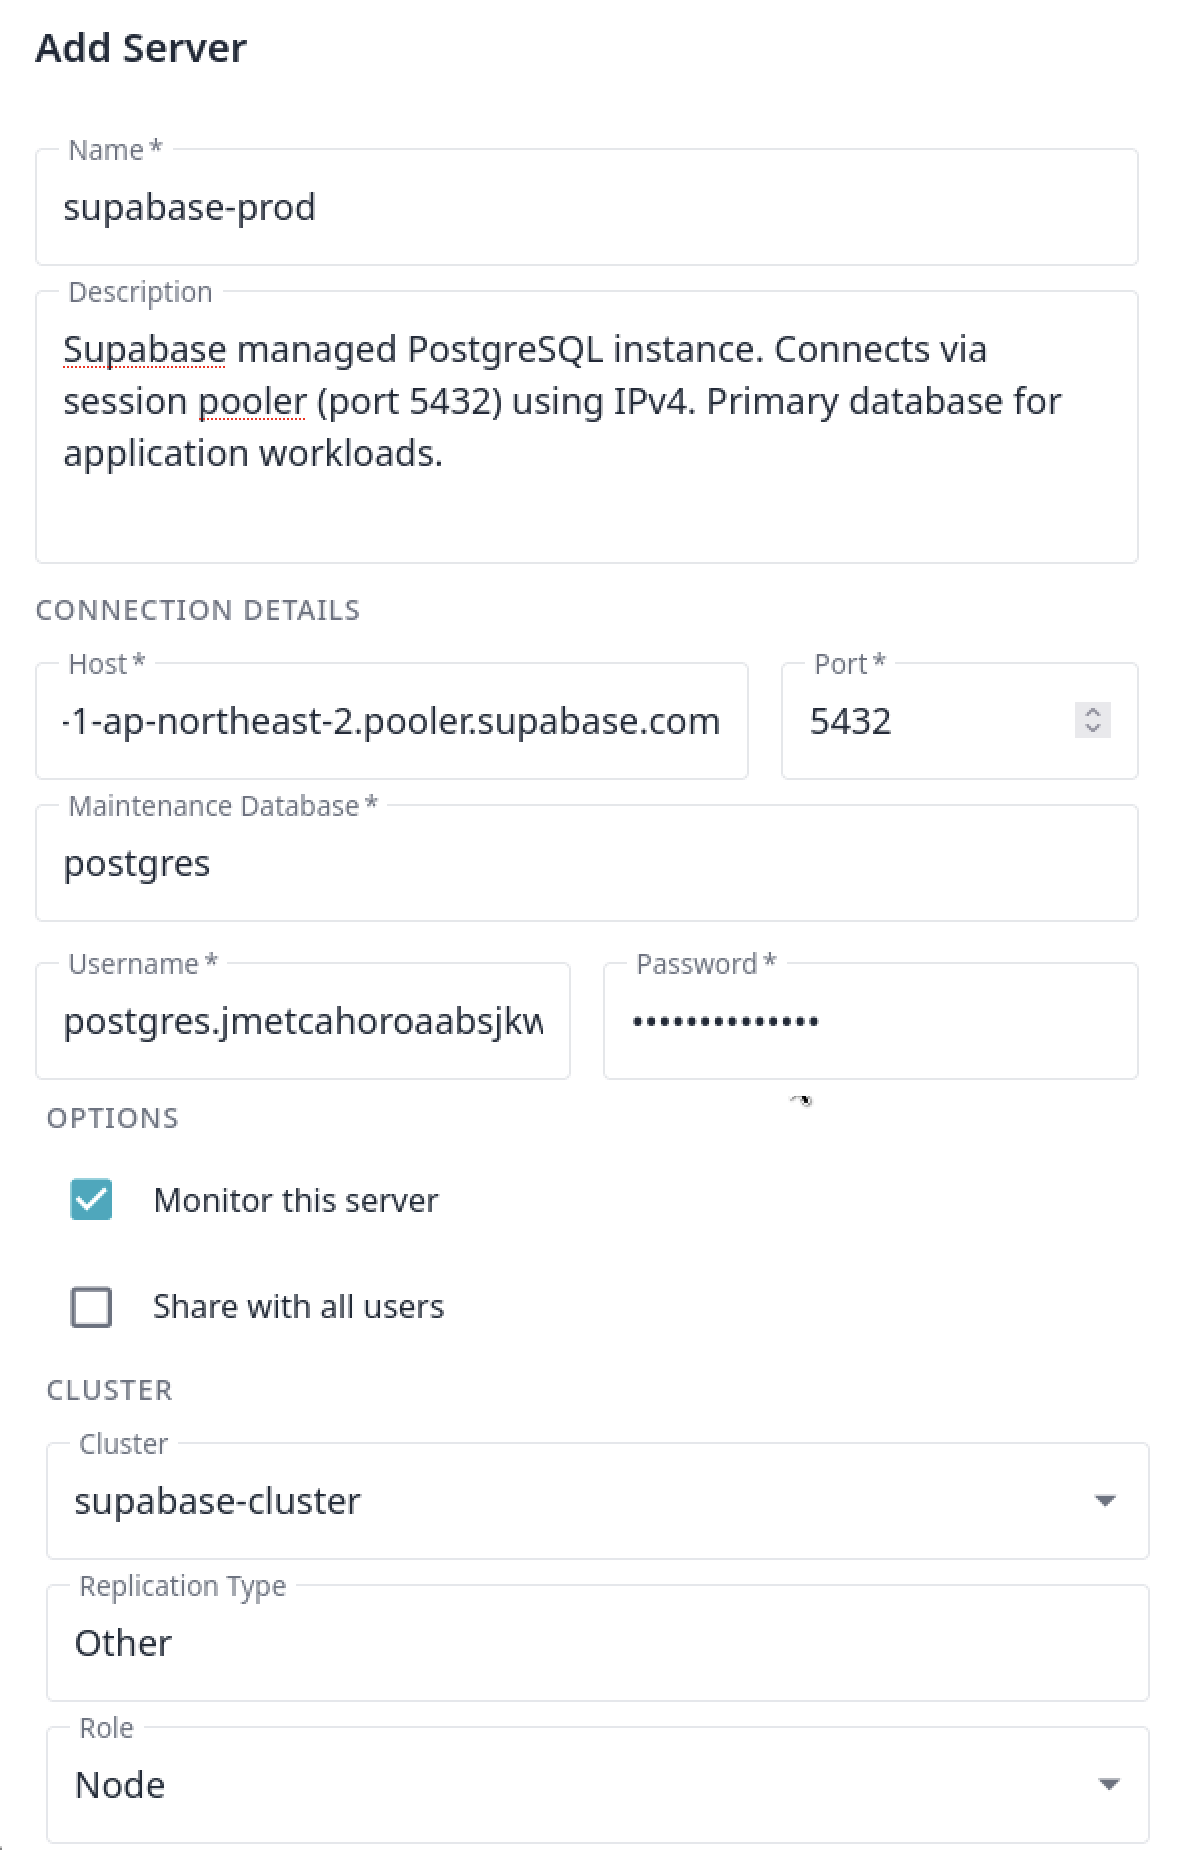
Click Add Server in the Workbench navigation panel.
Fill in the connection details using your Supabase Session Pooler credentials:
Field Value Host aws-1-ap-northeast-2.pooler.supabase.com (your specific pooler host) Port 5432 User postgres.[your-project-ref] (Pooler username format) Database postgres SSL disable Note: Setting ssl: disable is acceptable for testing, but in production use verify-full (preferred) or at minimum require to ensure secure connections.
Select the supabase-cluster you created in Step 3 from the cluster dropdown.
Set Role to Node.
Click Save to register the server.
The screenshots below show the Add Server form and the confirmation screen after saving:
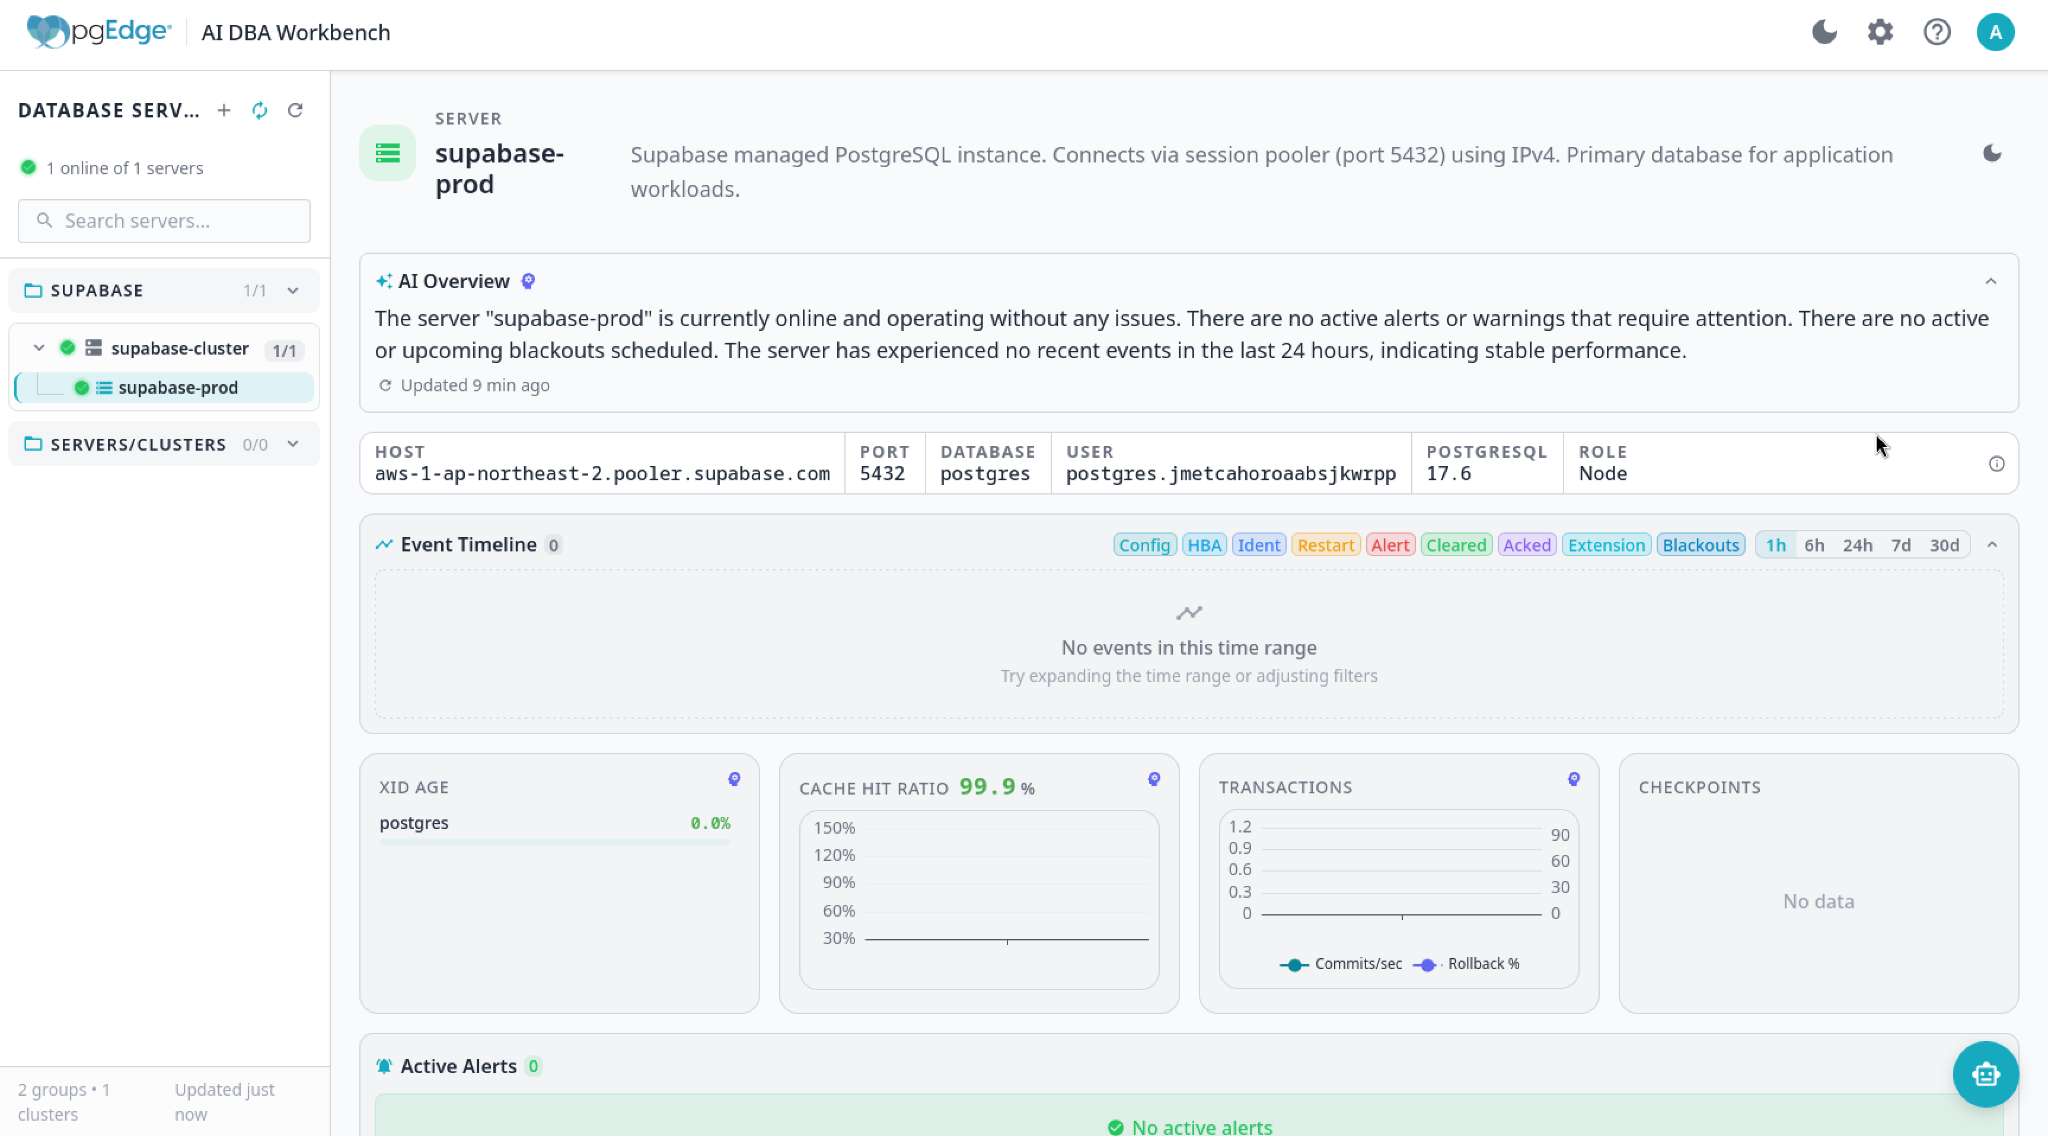
Step 5: Workbench GUI After Adding the Server
Here is what your workbench will look like after your Supabase database server has been successfully registered:
Exploring the AI DBA Workbench
Once connected, the Workbench begins gathering data immediately. Here’s what you can explore:
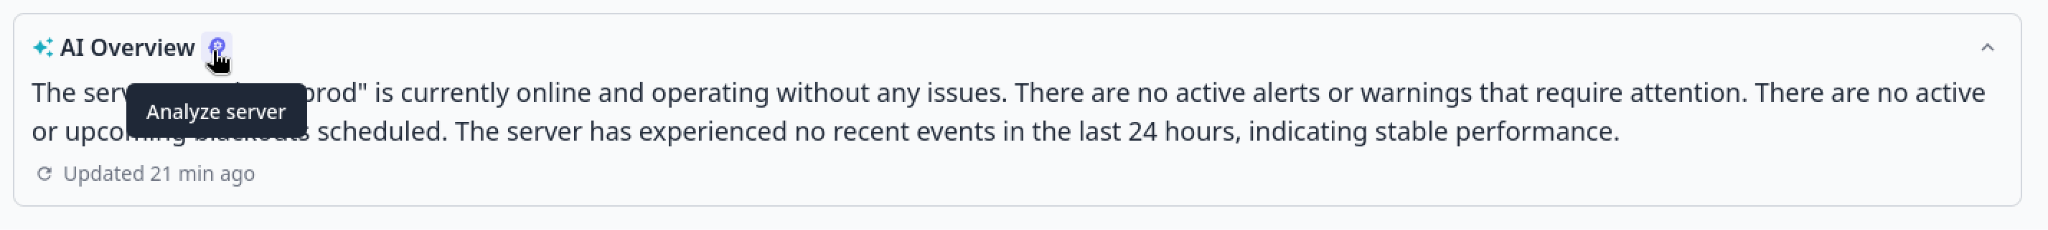
The AI Overview
Navigate to the AI Overview section. Here, the Workbench delivers an intelligent, plain-English summary of your Supabase server’s health, performance, and activity. It provides actionable insights based on current metrics and configuration so you don’t have to decipher raw numbers.
The Workbench also exposes its data through an MCP endpoint, so your AI coding tools (Claude Code, Cursor, VS Code Copilot, others) can pull live cluster metrics and alert history directly into your editor. The same data the chat interface sees is available to anything that speaks MCP.
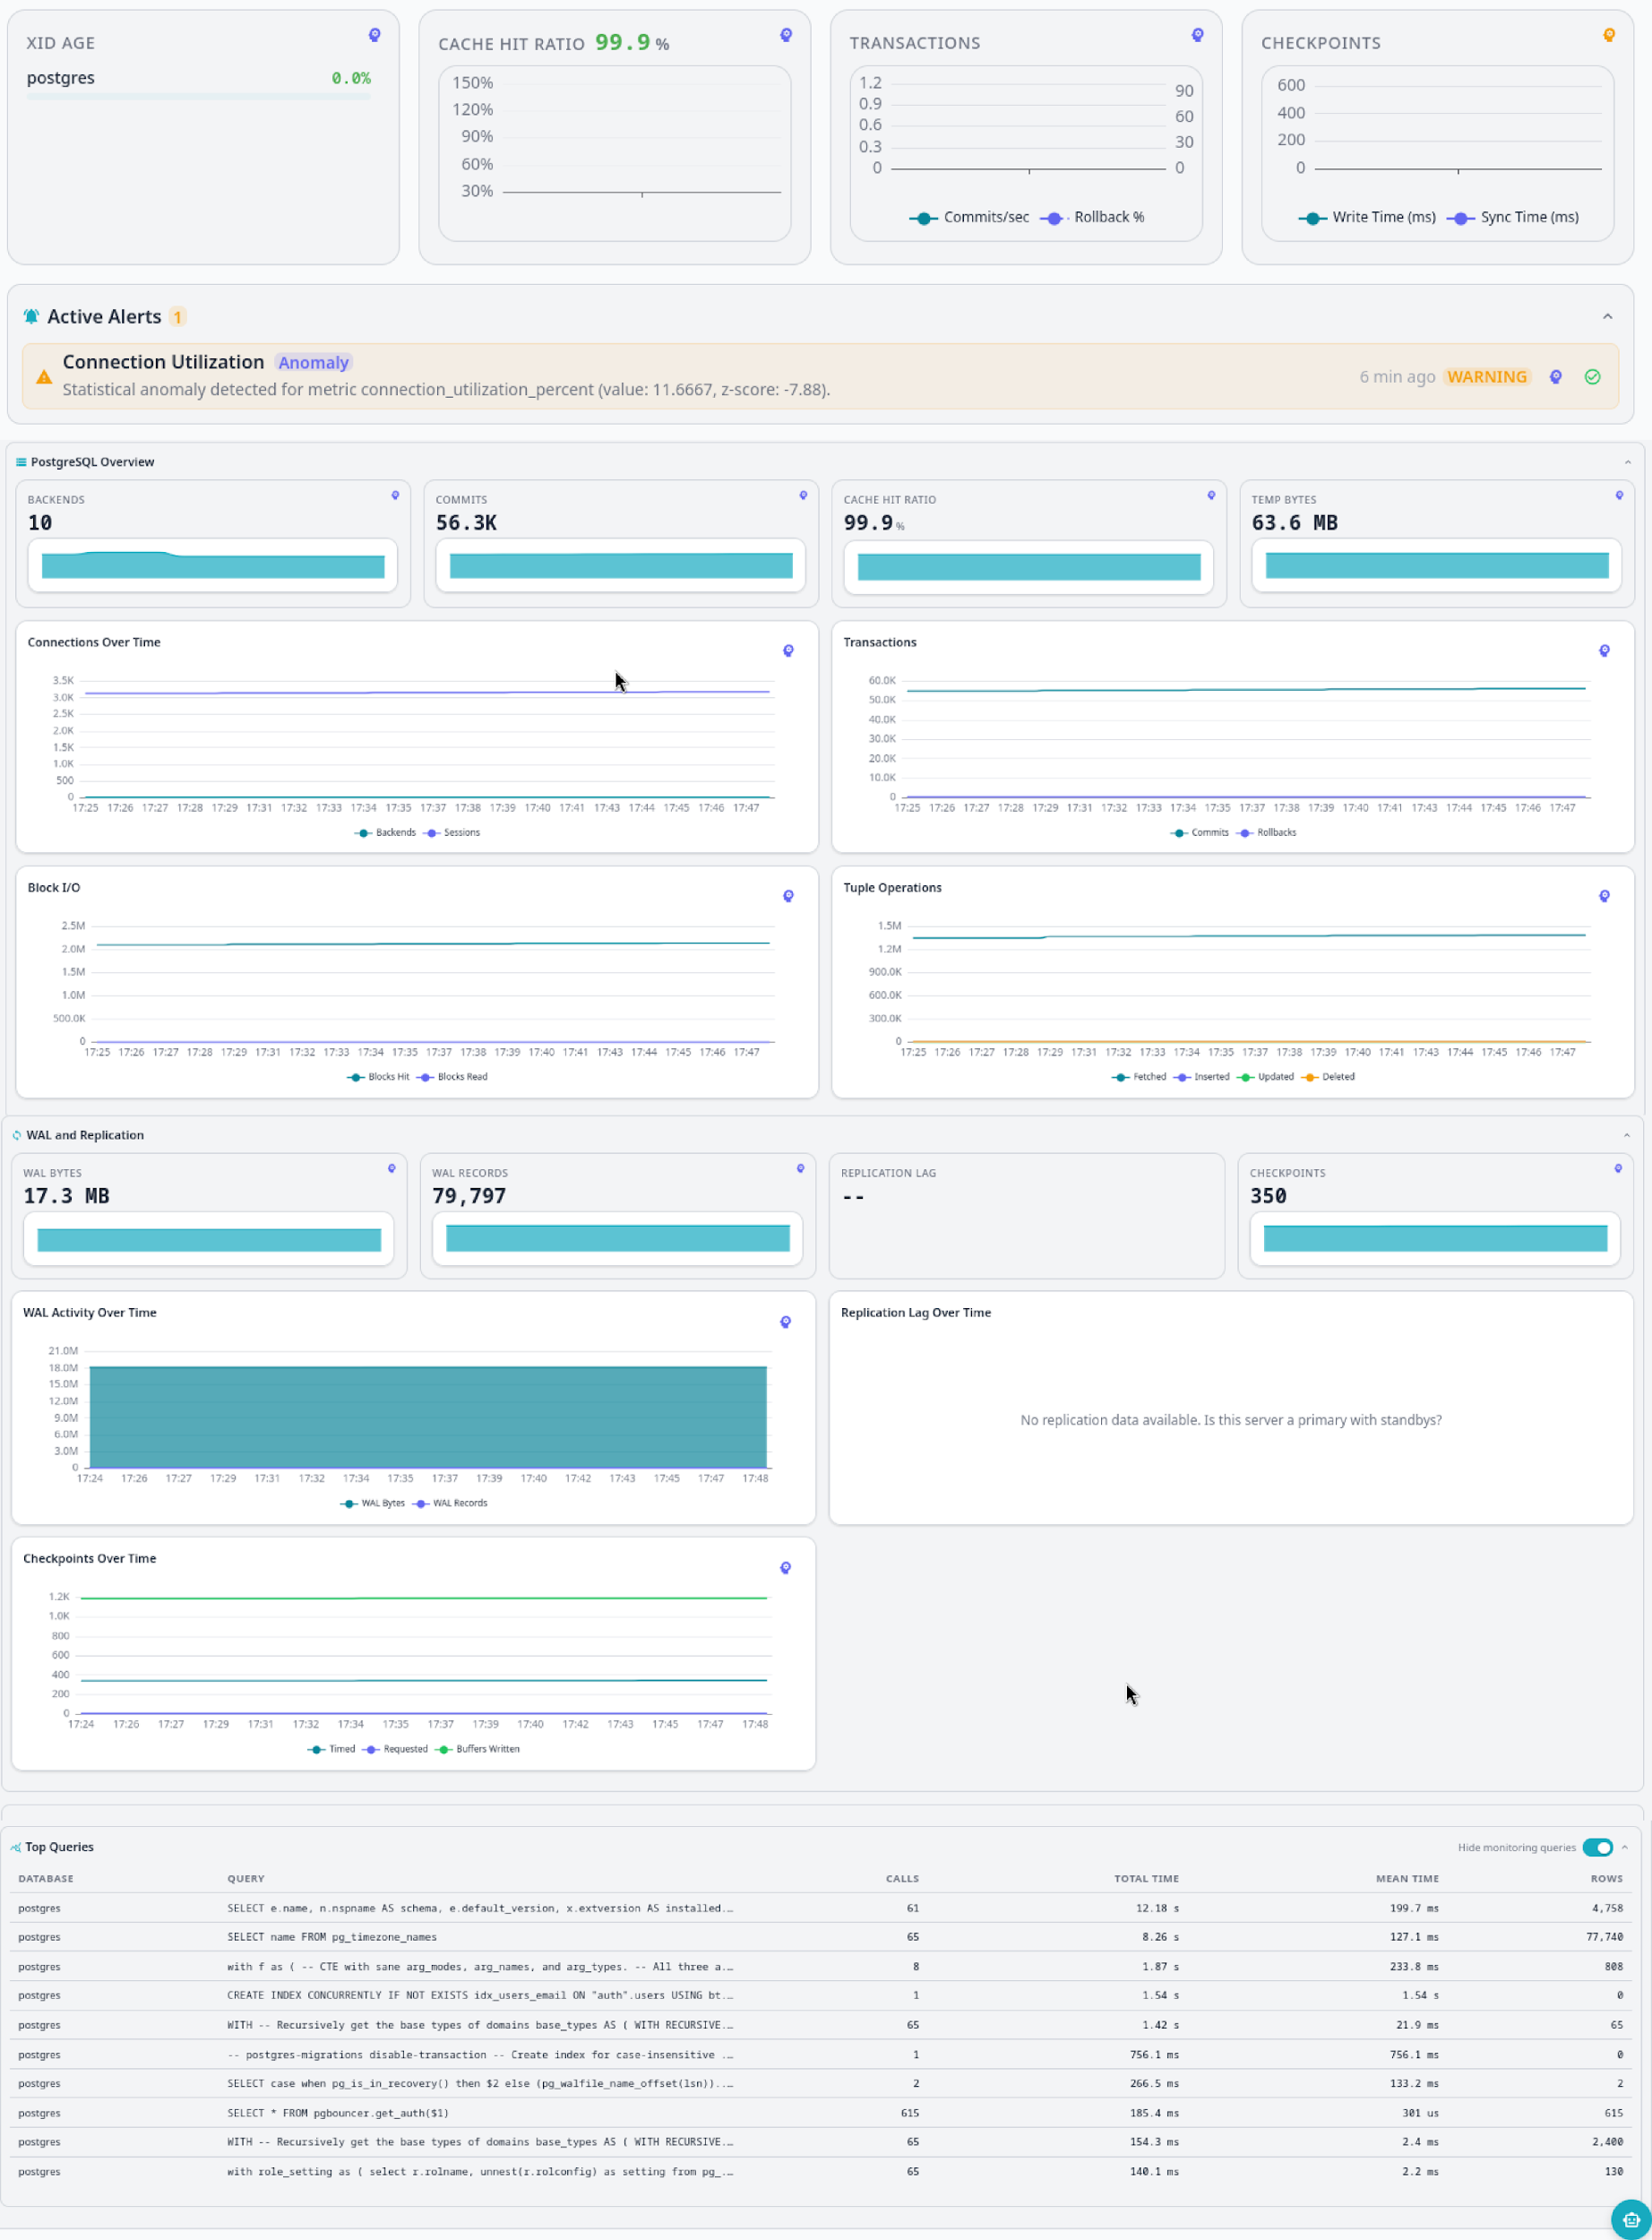
Metrics and Graphs
Dive into the detailed visual dashboards - the metrics and graphs section provides a real-time look into your connection pools, query performance, and resource utilization.
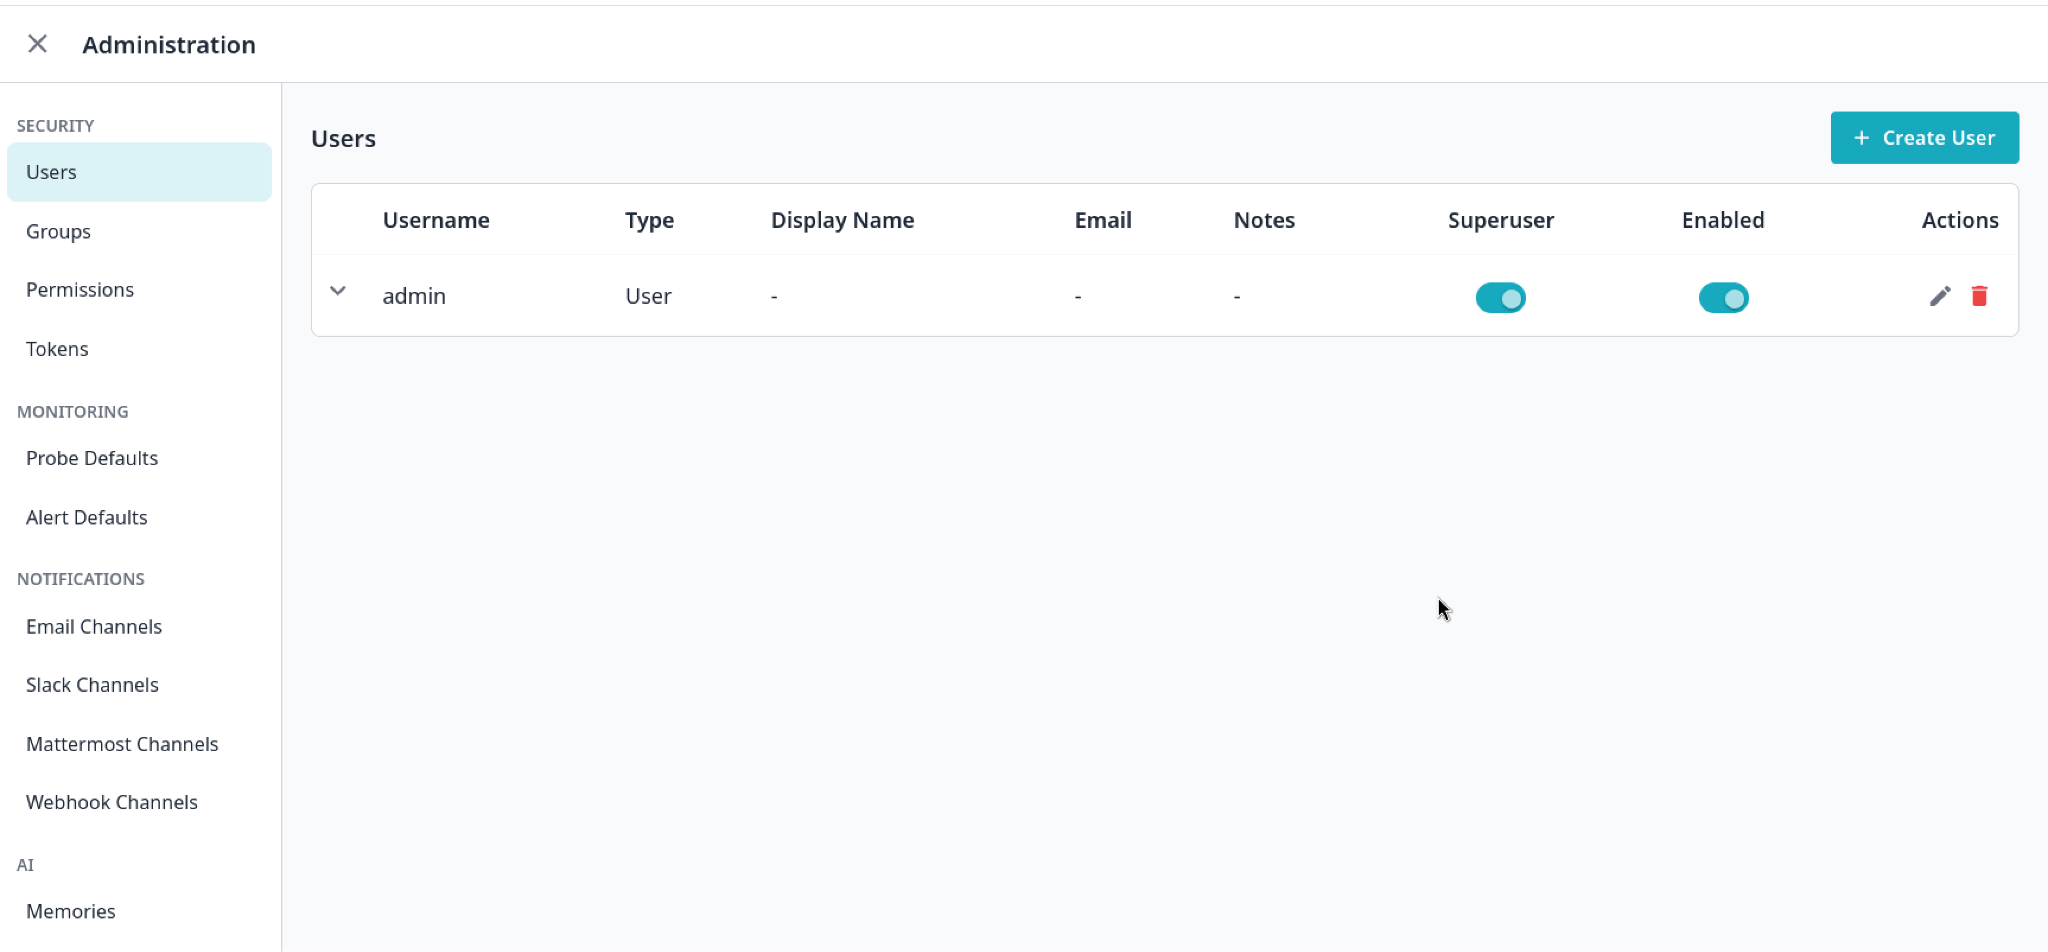
Administration Settings
Finally, check out the Administration Settings page. From here, you can manage users, create new groups, update connection strings, define custom alert rules, and configure notification channels to alert your team when anomalies occur.
Conclusion
The Workbench is built to monitor whatever Postgres you are actually running, not just pgEdge. Connecting your Supabase database, or any other flavor of PostgreSQL version 14+, to the pgEdge AI DBA Workbench gives you the best of both worlds: the seamless developer experience of Supabase, backed by enterprise-grade AI monitoring and diagnostics.
It’s open source under the PostgreSQL license. Give it a try on GitHub and let the AI DBA Workbench keep an eye on your performance: https://github.com/pgEdge/ai-dba-workbench
Or, learn more about the Workbench on our website where you can step through the video or tutorial for more information: https://www.pgedge.com/download/ai-dba-workbench