Optimising Cold Page Reads in PostgreSQL
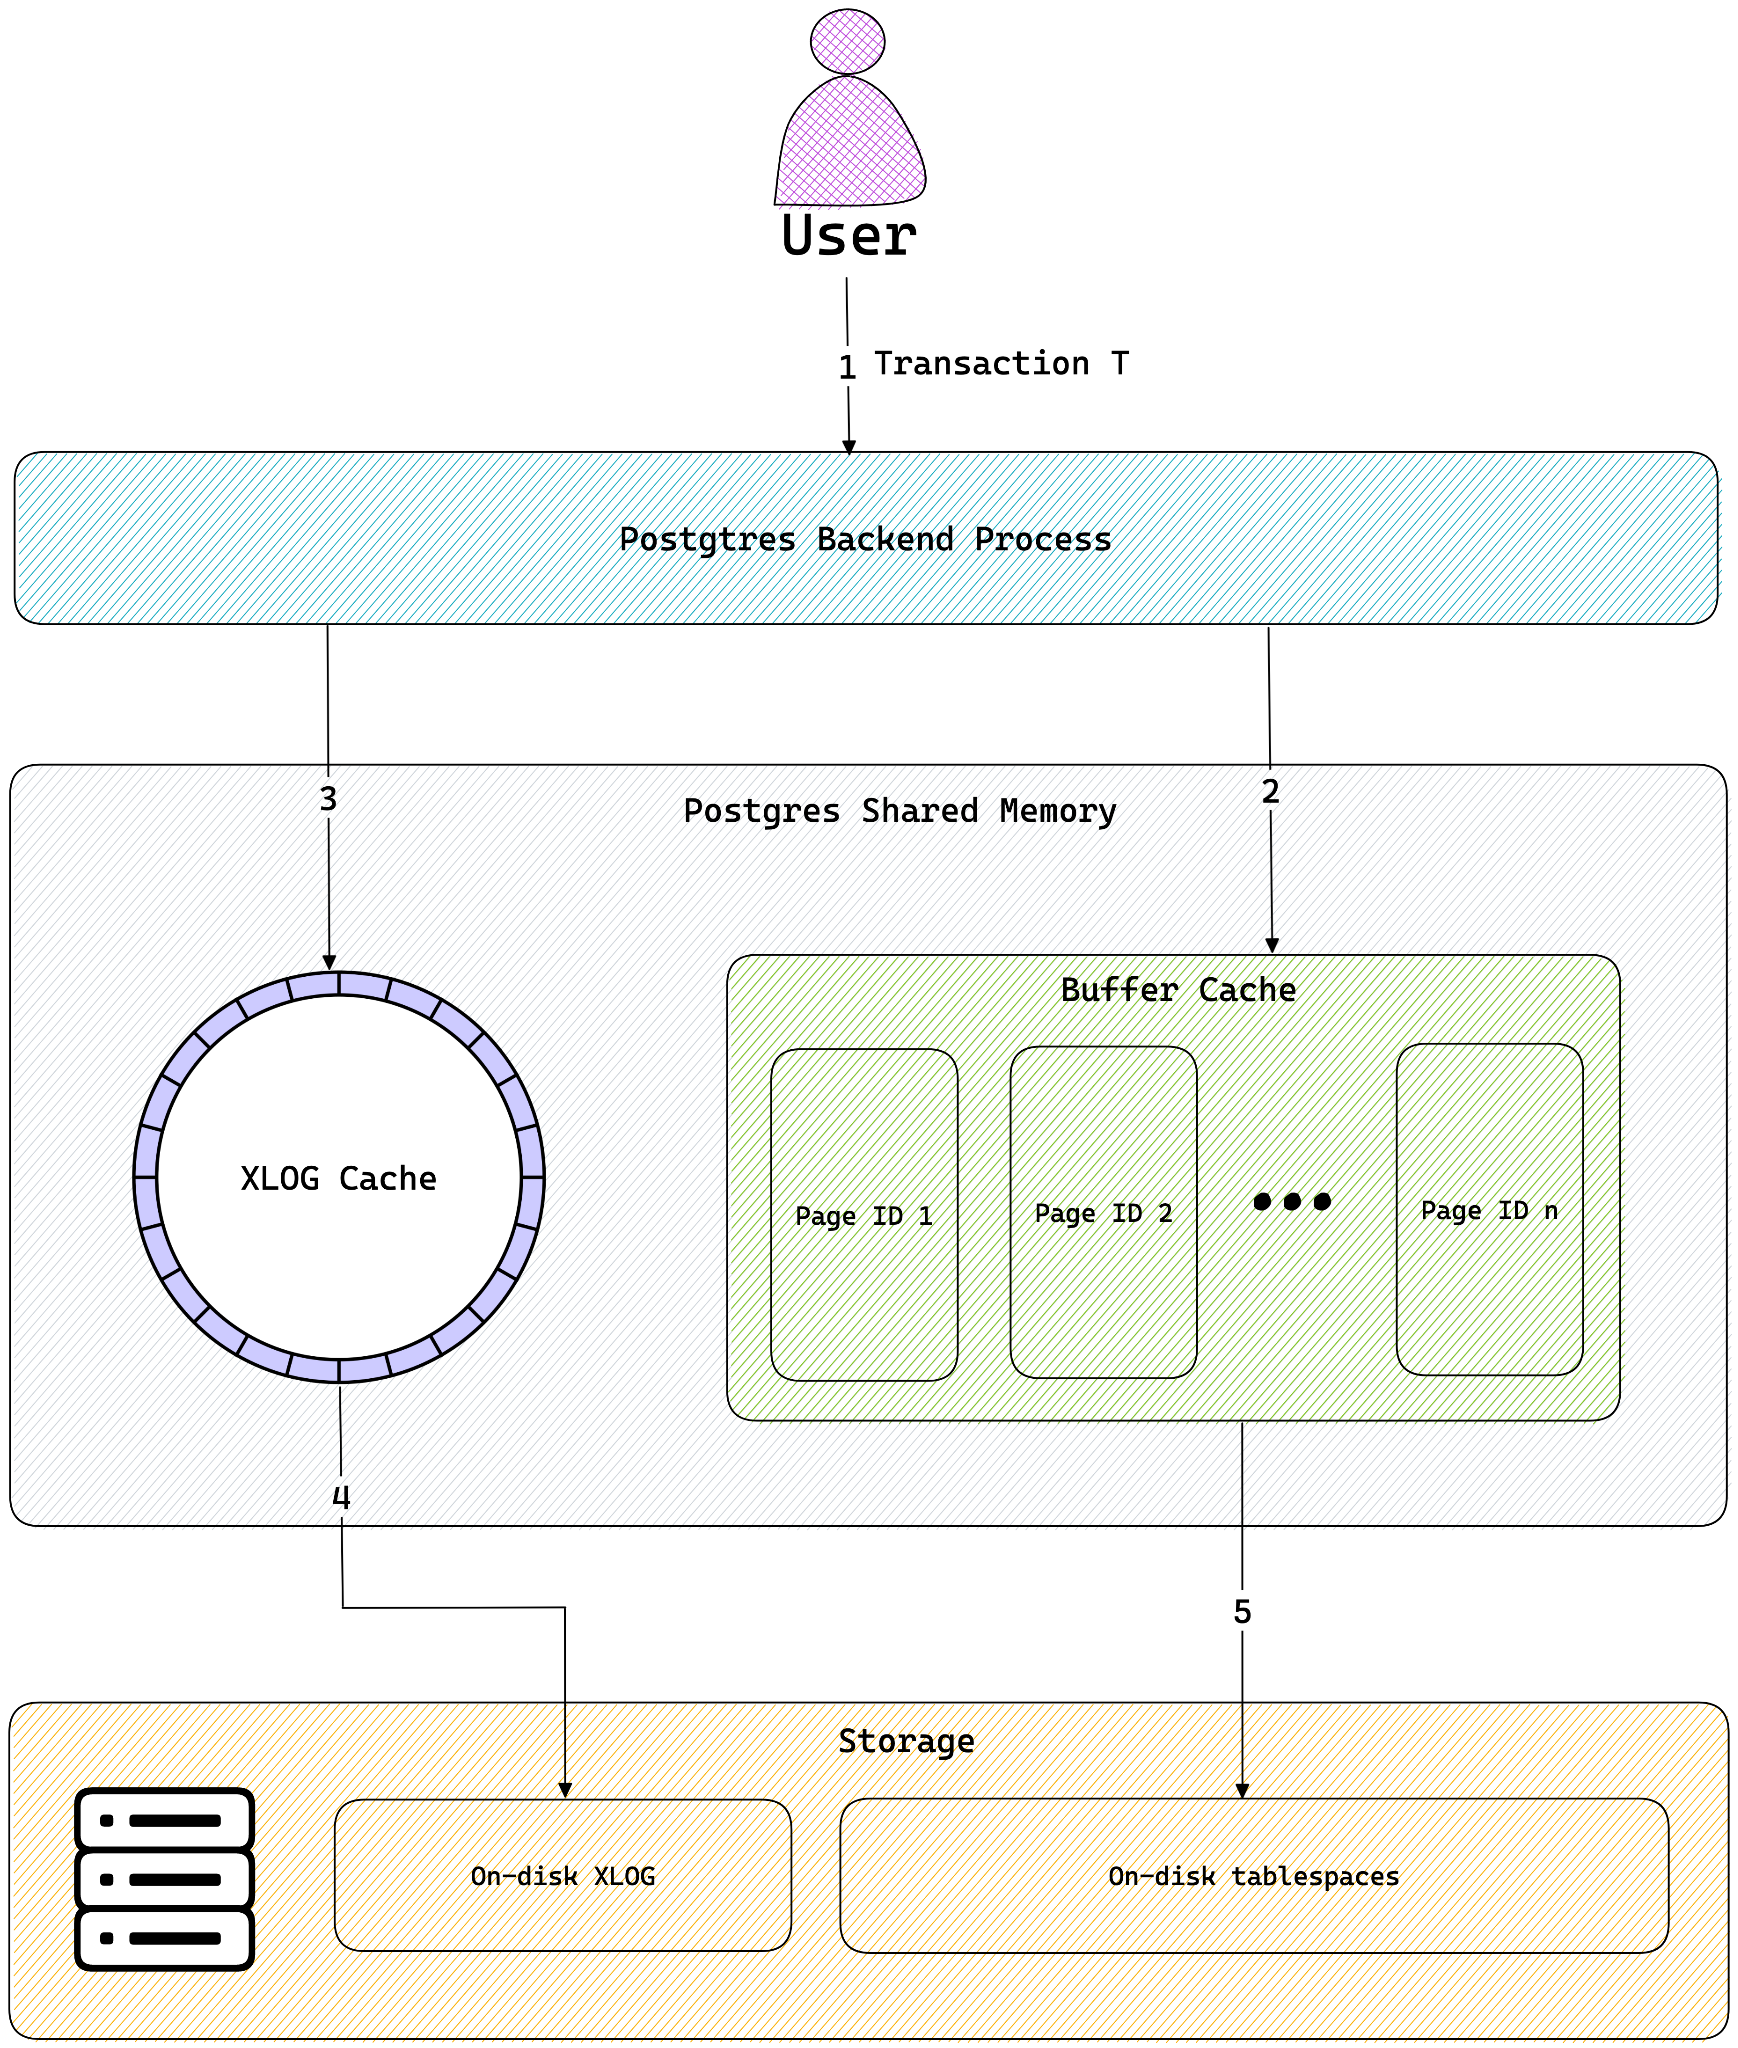
PostgreSQL has a fairly efficient buffer manager that handles data movement between shared memory and disk storage. Among other things, its primary purpose is to serve as a disk cache for the client backend processes for quick access to data. The size of this buffer is dictated by the setting shared_buffers in postgresql.conf, and its default value is 128 MB.
In many cases, the size of the buffer pool is much smaller than the size of the data on disk, which means that the first unlucky query to trigger a cache miss will bear the brunt of disk I/O when the page gets loaded from disk onto the buffer pool. This is referred to as a cold page read, or simply a cold read. A cold read is essentially a disk read caused by a query that needs data that is not currently in the database's buffer cache (shared buffers) or the operating system's page cache. It results in data being retrieved directly from disk storage, which is significantly slower than accessing data from memory.
But what happens when an application’s reads are almost entirely cold – such as in workloads involving full table scans? The TL;DR is that the application will indeed suffer from the latency overhead from cold page reads, but there is still some hope!
In this blog post, we will explore ways to reduce the latency of cold page reads for applications with non-traditional access patterns. This article is by no means a full or exhaustive treatment of tuning Postgres, but rather a focused guide to a specific class of cold read performance issues.
In a typical workload, queries that trigger disk I/O or cold page reads are not frequent enough to have a significant performance impact. However, the same cannot be said for applications or workloads where the access patterns are not amenable to caching – e.g., analytical queries that perform full table scans or applications that compute checksums on a table. Granted, these access patterns are not common, but cold page reads can quickly become a pain point for workloads that require full table scans or sequential access.
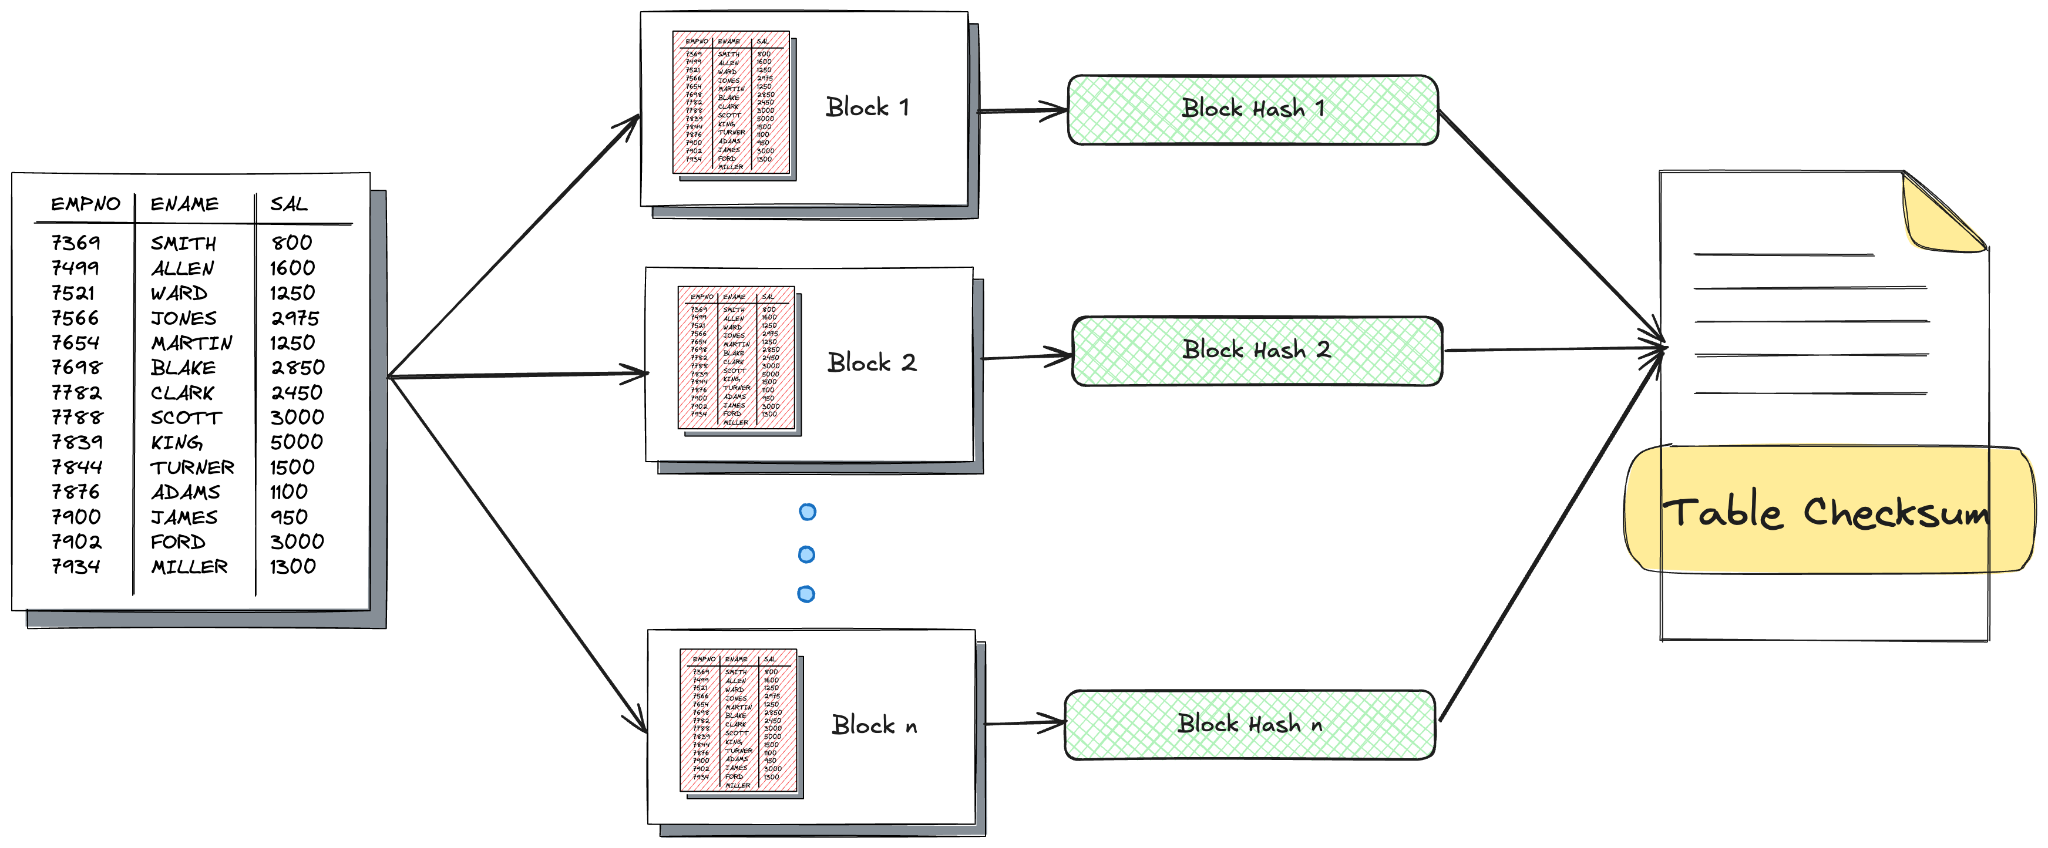
Let’s work with the example of computing a checksum on a table that is too large to fit in the buffer pool. Assume that the rows are divided into chunks based on primary keys, and each chunk is hashed separately before all of the individual hashes are rolled up into a single checksum. For the pages that are already in the buffer pool, the hash computation itself is pretty fast. However, since our table is much larger than the buffer pool, cold reads happen for almost every block that needs to be hashed. To make matters worse, once the block is loaded into the buffer pool and hashed, it is no longer useful since we already have its checksum. Therefore, Postgres needs to continuously perform cold page reads and cache evictions for use cases involving full table scans.
 Here’s a sample output of an EXPLAIN (ANALYZE, BUFFERS, TIMING, COSTS) on a query that triggered a cold page read. Almost 35% of the execution time is spent on I/O, i.e., reading the cold page from disk.
demo=# explain (analyze, buffers, timing, costs) WITH slice AS (SELECT * FROM customers_huge WHERE customer_id BETWEEN 1789000 AND 1997000) SELECT encode(digest(string_agg(slice::text, '|' order by customer_id), 'sha256'), 'hex') FROM slice;
                                                                        QUERY PLAN
----------------------------------------------------------------------------------------------------------------------------------------------------------
 Aggregate  (cost=6374264.91..6374264.93 rows=1 width=32) (actual time=885.485..885.487 rows=1 loops=1)
   Buffers: shared hit=2 read=26571
   I/O Timings: shared read=310.763
   ->  Index Scan using customers_pkey on customers_huge  (cost=0.57..6361610.27 rows=1687285 width=264) (actual time=0.874..359.851 rows=208001 loops=1)
         Index Cond: ((customer_id >= 1789000) AND (customer_id <= 1997000))
         Buffers: shared hit=2 read=26571
         I/O Timings: shared read=310.763
 Planning:
   Buffers: shared hit=24 read=2
   I/O Timings: shared read=0.155
 Planning Time: 0.281 ms
 Execution Time: 890.887 ms
(12 rows)
Fortunately, there are a few measures we can take to ameliorate this. Perhaps the most significant difference is caused by the effective_io_concurrency setting. Increasing effective_io_concurrency tells Postgres to use more concurrency when issuing I/O requests to disk. Lowering random_page_cost imposes a smaller penalty on random disk accesses – something that modern SSDs are much more well equipped to do compared to spinning magnetic disks.
# Enable concurrent disk I/O (especially useful on SSDs)
effective_io_concurrency = 200

# Lower penalty on random accesses
random_page_cost = 1.1 # For SSDs (use 4 for HDDs)Increasing parallelism for query execution also helps.
# Enables parallel workers to be used more aggressively
max_parallel_workers = 8
max_parallel_workers_per_gather = 4

# Reduce planner cost estimates to favour parallel plans
parallel_setup_cost = 1000
parallel_tuple_cost = 0.1
In addition to these settings, an OS-level setting that can help greatly improve cold page read latency is the disk readahead size. Increasing the readahead to, say, 2 MB (4096 x 512 byte sectors) tells the Linux kernel to read up to 2 MB ahead of time when sequential access patterns are detected.
# Use lsblk to identify the device containing the PG data directory
sudo blockdev --setra 4096 /dev/nvme0n1
After tweaking these settings and restarting Postgres to clear the shared buffers, here’s the result of the same query:.
QUERY PLAN
----------------------------------------------------------------------------------------------------------------------------------------------------------
 Aggregate  (cost=1786563.51..1786563.53 rows=1 width=32) (actual time=756.777..756.779 rows=1 loops=1)
   Buffers: shared hit=3 read=26573
   I/O Timings: shared read=188.234
   ->  Index Scan using customers_pkey on customers_huge  (cost=0.57..1773908.87 rows=1687285 width=264) (actual time=0.070..236.214 rows=208001 loops=1)
         Index Cond: ((customer_id >= 1789000) AND (customer_id <= 1997000))
         Buffers: shared hit=3 read=26573
         I/O Timings: shared read=188.234
 Planning:
   Buffers: shared hit=85 read=14
   I/O Timings: shared read=0.137
 Planning Time: 0.769 ms
 Execution Time: 761.951 ms
(12 rows)
The I/O latency in the second scenario is about 25% of the query execution time overall, but it is nearly 40% less than it was before the optimisations were applied. Adjusting these parameters may not have a significant impact on a single query that involves a cold read, but it does result in non-trivial performance gains when several cold reads occur consecutively. This is primarily driven by the readahead setting in the Linux kernel that prefetches blocks when it detects such access patterns.
As for the checksum application we talked about previously, preliminary testing revealed that these settings helped improve the checksum time by at least 30%. Results may vary depending on factors like disk type (SSD vs. HDD), disk format (ext4, xfs, etc.), Postgres-related settings, CPUs available, memory size of the server, and so on. Nevertheless, changing these settings should still help bring down the latency when full table scans are involved.
While no amount of tuning can fully eliminate the inherent latency of cold page reads, especially when working with datasets far larger than available memory, these optimisations can measurably reduce their impact. At the very least, they will help Postgres budget and plan query costs a little less conservatively when operating on modern hardware. Lastly, these settings can not only help improve the performance of queries that trigger several cold reads, but also other routine queries as well.