Replicating CrystalDBA With pgEdge MCP Server Custom Tools
A disclaimer before we start: I'm product management, no longer an engineer. I can read code, I can write it … incredibly slowly. I understand PostgreSQL at a product level, and I know what questions to ask. But the code in this project was written by Claude - specifically, Claude Code running in my terminal as a coding agent. I directed the architecture, made the design calls, reviewed the output, and did the testing. Claude wrote the code. This is a vibe-coding story as much as it is a technical one.
The pgEdge Postgres MCP Server has a custom tool system. You write PL/pgSQL in a YAML file, drop it into the config, and the server exposes it as an MCP tool. I wanted to find out how far that system could go - not with toy examples, but with something genuinely hard.
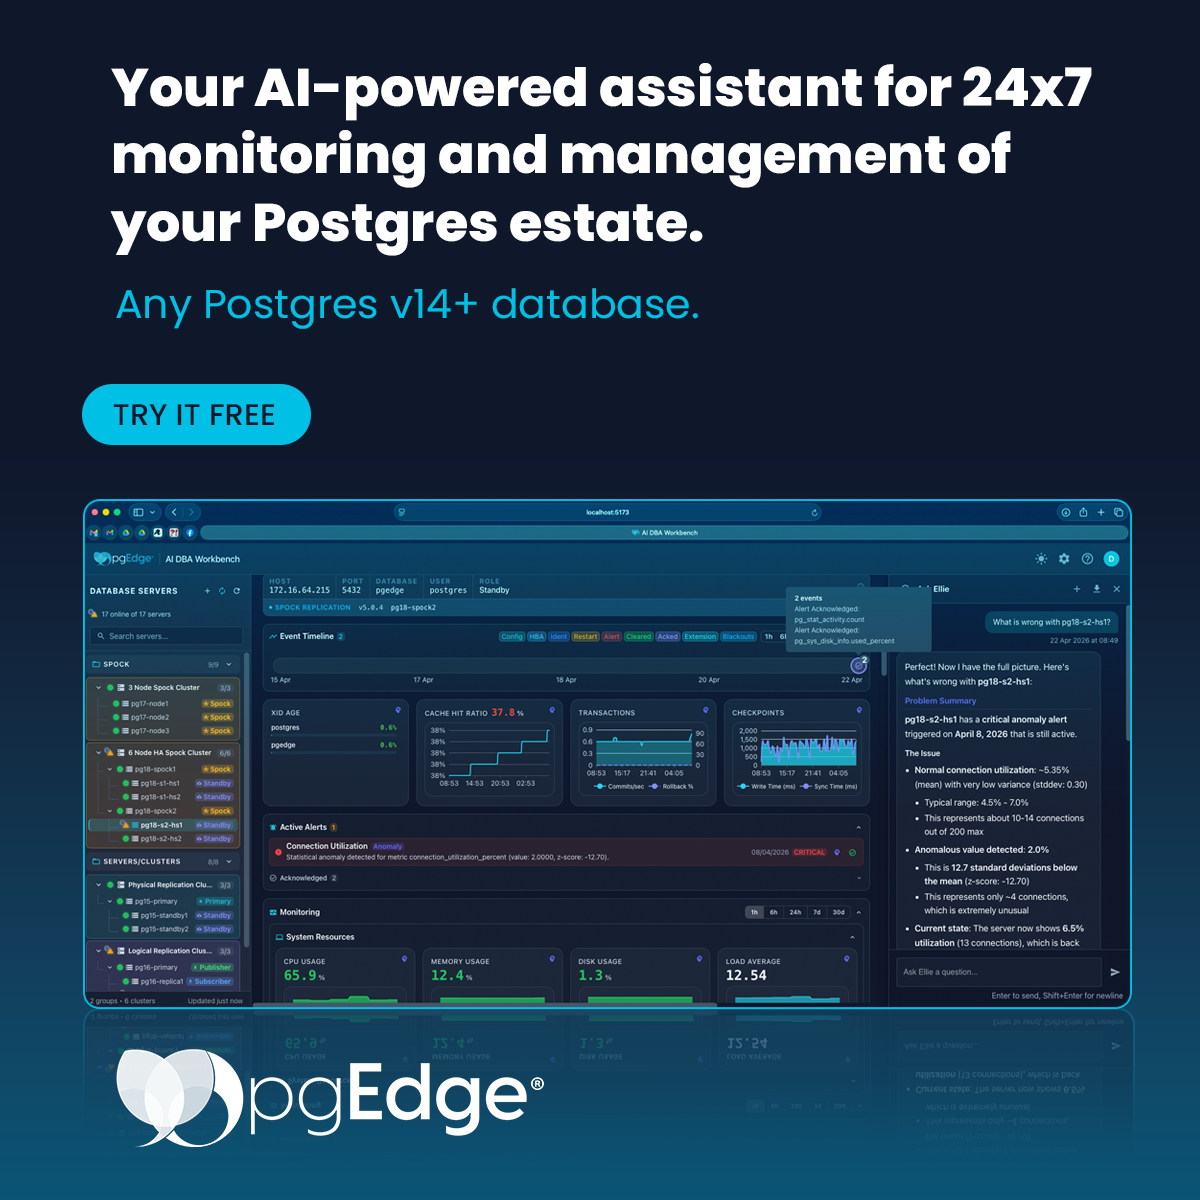
The pgEdge Postgres MCP Server
The pgEdge Postgres MCP Server connects AI agents and tools - Claude Code, Claude Desktop, Cursor, and others - directly to any PostgreSQL database. It supports Postgres 14 and newer, including standard community Postgres, Amazon RDS, and managed services. It's open source under the PostgreSQL licence.
The server handles multi-database connections, user and token authentication, TLS, read-only enforcement, and optional write access. It runs over both stdio and HTTP transports. You can read more about it on the pgEdge AI Toolkit page or in the documentation.
The feature that matters for this post is custom tools. You define MCP tools in a YAML file - SQL queries, PL/pgSQL code blocks, or stored function calls - and the server exposes them alongside its built-in tools. No recompilation, no plugins. Drop in the YAML, point the config at it, restart.
CrystalDBA: The Benchmark
The Crystal DBA team built one of the most popular Postgres MCP servers on GitHub - over 2,000 stars, and deservedly so. Their postgres-mcp server packs genuine DBA intelligence into a clean MCP interface: health checks, top query analysis, and an index tuner that uses real cost-based simulation. It's impressive work.
One thing worth noting: the project's development has slowed. The most recent commit is from January 2026, and there are 25 open issues - some dating back to April 2025 - with many unanswered. That's not a criticism. Open source maintainers don't owe anyone their time, and what the Crystal DBA team shipped is genuinely good, but if you're evaluating MCP servers for production use, activity matters. It was another reason I wanted to see if our custom tools system could cover the same ground - not to replace CrystalDBA, but to offer an actively maintained alternative for teams that need DBA tooling in their MCP workflow.
How CrystalDBA Works
CrystalDBA is a standalone MCP server for PostgreSQL database administration - health checks, top query analysis, and index tuning with hypothetical index simulation. The kind of things a DBA reaches for daily.
Under the hood, it's a ~4,000-line Python application with a non-trivial architecture. Three things matter:
pglast is a Python SQL parser that wraps PostgreSQL's own parser (libpg_query) via C bindings. CrystalDBA uses it to parse normalised queries from pg_stat_statements into abstract syntax trees, then walks those trees to extract every column referenced in WHERE clauses, JOIN conditions, ORDER BY, and GROUP BY. That's how it generates index candidates - it knows exactly which columns each query filters and joins on.
HypoPG is a PostgreSQL extension for hypothetical indexes. You create a "what-if" index without actually building it, then run EXPLAIN to see whether the query planner would use it. CrystalDBA pairs pglast's candidate extraction with HypoPG's cost simulation to validate whether each candidate actually helps.
The execution model is server-side Python. CrystalDBA runs pglast in the Python process that hosts the MCP server. It connects to PostgreSQL as a client, pulls queries, parses them locally, generates candidates, then reaches back into PostgreSQL to create hypothetical indexes and run EXPLAIN. The intelligence lives in the server, not in the database.
That's the system I wanted to recreate, as a drop-in YAML file. No changes to the pgEdge server binary, no new dependencies, just PL/pgSQL running inside PostgreSQL.
Why Not Just Use query_database?
Before building anything, I checked whether named tools were even necessary. The pgEdge server already has query_database. Every DBA diagnostic is just a SQL query:
SELECT left(query, 80) as query_snippet,
       calls,
       total_exec_time::numeric(10,2) as total_ms
FROM pg_stat_statements
ORDER BY total_exec_time DESC
LIMIT 5
Top queries - done. Unused indexes? One query against pg_stat_user_indexes. Buffer cache hit rates? pg_statio_user_tables. The capability already exists.
But LLMs don't always reach for it. The query_database tool describes itself as a tool for "structured, exact data retrieval" with examples like "How many orders were placed last week?" An LLM scanning that description thinks "business data tool," not "DBA diagnostic tool." When a user asks "why is my database slow?" the LLM doesn't reach for query_database to check pg_stat_statements if it doesn't know it should.
CrystalDBA has a tool named get_top_queries with a description about "slowest or most resource-intensive queries." which is impossible to miss.
This is a UX problem, not a capability problem. Named tools with DBA-oriented descriptions solve it. And there's a bonus effect - the mere presence of a DBA tool in the tool list shifts how the LLM perceives the other tools. Once it sees analyze_db_health, it understands this is a DBA-capable server and becomes more willing to use query_database for adjacent diagnostic queries too. One tool shifts the entire context.
How Custom Tools Work
It helps to understand the execution model, because it shapes every design decision that follows.
The pgEdge server supports three custom tool types: sql (a plain query), pl-func (a temporary stored function), and pl-do (an anonymous code block). All three execute inside PostgreSQL. The server is written in Go, but custom tools don't run Go code, they run database code.
I used pl-do for all three DBA tools. Here's the flow:
The LLM sends a standard MCP
tools/callrequest with the tool name and parameters as JSON.The Go server wraps the YAML
code:block into a PostgreSQL anonymous DO block. It injects two variables:args(input parameters as JSONB) andresult(a JSONB variable you populate with your output).PostgreSQL executes the DO block. The PL/pgSQL code reads parameters from
args, runs whatever queries it needs, and builds a JSON result.To return data, the code calls
set_config('mcp.tool_result', result::text, true). This stashes the result in a transaction-local configuration variable.The Go server reads the result back with
current_setting('mcp.tool_result', true)and packages it into the MCP response.
JSONB in, set_config out, PL/pgSQL in between. That's the entire interface.
A custom tool can do anything PostgreSQL can do - query system catalogues, call extensions, run EXPLAIN, create hypothetical indexes with HypoPG, loop and branch with procedural logic. But it cannot do anything PostgreSQL can't - no HTTP calls, no filesystem access, no shelling out. The tool runs inside the database, not inside the server process. This is the constraint that makes the CrystalDBA comparison interesting.
The pglast Problem
CrystalDBA runs pglast in its server process - a Python library wrapping a C parser. I can't do that. Custom tools run inside PostgreSQL, and PL/pgSQL has no SQL parser.
The Go equivalent (pg_query_go) wraps the same C library, which means it requires CGO. We literally just spent effort removing CGO from the project to get pure Go static binaries. Adding it back would undo that work.
I could use pglast inside a PL/Python custom tool running inside PostgreSQL via plpython3u, but most managed Postgres services don't support untrusted PL languages. Not a great dependency for a "drop-in" toolkit.
So the question became: what does pglast actually give CrystalDBA that I can't approximate without it?
Regex Beats AST (When You Have a Validator)
pglast extracts columns from query conditions precisely by using an Abstract Syntax Tree, which is a fancy way of stripping away the surface level syntax and leaving only the meaningful structural relationships. Regex pattern matching does it noisily - it catches most columns but also picks up some it shouldn't.
Here's the thing: it doesn't matter that much. Every candidate index gets tested through HypoPG. A bad candidate shows no cost improvement and gets discarded. The algorithm self-corrects. Noisy candidate generation produces the same final recommendations - it just evaluates a few extra candidates along the way. Table alias resolution? FROM orders o is a regex pattern. FROM orders AS o is a regex pattern. You don't need an AST for that. Column extraction from WHERE clauses? WHERE column_name = is a regex pattern. JOIN ... ON table.column = is a regex pattern. Imprecise, sure. But HypoPG handles the imprecision.
The worst case is slightly slower analysis (more HypoPG rounds), not worse recommendations, and I gave the search loop a 30-second time budget anyway.
Graceful Degradation
CrystalDBA requires HypoPG - If the extension isn't installed, the tool errors out, full stop. I wanted to make something useful, even without HypoPG, so the toolkit has two tiers:
Tier 1 runs without any extensions. It checks system catalogues for missing foreign key indexes, tables with excessive sequential scans, unused indexes, and duplicate indexes. This is heuristic, no cost simulation, but it's useful information CrystalDBA doesn't offer at all.
Tier 2 runs when HypoPG is available. Full simulation-based analysis with regex candidate generation and a greedy search loop.
The tool auto-detects what's installed and uses the best available tier. One tool, two modes, always useful.
Token Budget
More tools means more token usage. Every tool definition (name, description, parameter schema) gets sent to the LLM on every request. Research shows LLMs start making worse tool choices as the list grows.
The pgEdge server has about 11 built-in tools. Adding three more is roughly 600-900 extra tokens per request. That's fine at this scale, but I used the token budget concern to drive design decisions anyway. Instead of replicating CrystalDBA's seven separate health check tools, I built one combined analyze_db_health with a check_type parameter. One tool in the list, seven capabilities behind it.
What CrystalDBA Actually Does
I had Claude go through CrystalDBA's codebase and break down what each tool does and how. Here's what it found.
Health checks: Seven categories: index, connection, vacuum, sequence, replication, buffer, constraint. Some are sophisticated (the index bloat calculation is a multi-CTE query that estimates btree page counts). Some are surprisingly basic (the connection health check just counts connections against hardcoded thresholds of 500 total and 100 idle). I wanted to match the sophisticated parts and improve the basic ones.
Top queries: Three sort modes including a "resources" mode that computes fractional consumption across five dimensions - execution time, shared blocks accessed/read/ dirtied, and WAL bytes. I matched all three modes and added a min_calls filter to cut noise from one-off queries.
Index tuning: CrystalDBA's index tuner is a ~670-line Python system. It uses pglast for candidate extraction and HypoPG for validation. The approach here was to replace pglast with regex, add Tier 1 heuristics, and keep the HypoPG simulation loop. The Tier 2 replaces $N bind parameters with NULL before running EXPLAIN - cruder than CrystalDBA's type-aware substitution via pglast, but functional. The planner still produces a reasonable execution plan, and the before/after cost comparison holds because both runs use the same substitution.
What I Shipped
Three custom tools in a single YAML file:
get_top_queries - Three sort modes, extension detection, PG version-aware column names.
analyze_db_health - Seven health check categories, JSON output with summary scoring.
recommend_indexes - Two-tier degradation, regex-based candidate generation, HypoPG simulation.
No core server changes. No new dependencies. No CGO. Drop in the YAML file, add one line to the config, restart.
The final YAML file is 1,668 lines. Most of that is PL/pgSQL inside code: | blocks. The analyze_db_health tool alone is ~780 lines because it packs seven diagnostic categories into a single anonymous DO block. Verbose, sure. But it's one tool in the tool list, not seven.
PL/pgSQL Will Hurt You
Testing on PG 18 surfaced two bugs worth documenting because they're the kind of thing that silently eats your results and leaves no trace.
The jsonb array concatenation bug. PL/pgSQL's || operator behaves differently depending on how you give it its operands. This works:
elem := candidates->0;
arr := arr || elem;        -- produces [{"a":1}]
This doesn't:
arr := arr || candidates->0; -- produces {"a":1}Same types. Same values. Different results. When the right-hand side comes from the -> operator inline, PL/pgSQL treats it as an object merge instead of an array append. The empty array quietly becomes a plain object. Every downstream jsonb_typeof(x) = 'array' check fails. Every FOR i IN 0..jsonb_array_length(x) loop gets -1 as its upper bound and silently skips. Zero simulation results. No error. No warning. Nothing.
The fix is jsonb_build_array():
arr := arr || jsonb_build_array(candidates->i);Explicit. Unambiguous. Works every time. I hit this in both the candidate deduplication and the existing-index filter - two places where the simulation pipeline builds arrays by appending extracted elements.
The int2vector indexing bug. PostgreSQL's pg_index.indkey column is an int2vector - a compact array of column attribute numbers. Standard PostgreSQL arrays are 1-based. int2vector is 0-based. So indkey[0] is the first indexed column, and indkey[1] is the second.
I wrote indkey[1]. For single-column indexes, indkey[1] returns 0. No real column has attnum = 0. So the existing-index filter matched nothing and let every candidate through - including columns that already had perfectly good indexes. The simulation would then show 0% improvement (the index already exists), and the candidate would be quietly discarded. Correct final result, completely wrong intermediate logic, impossible to spot without tracing every step.
Both bugs shared the same signature: silent failure producing plausible-looking output. The tool returned heuristic recommendations and reported "tier": "simulation". Everything looked right. it just had zero simulation results where there should have been three. Without end-to-end testing against a real database with known-good data, I'd have shipped it.
Did It Work?
Testing confirmed all three tools compile and execute on PG 18 without errors. The test database surfaced four missing foreign key indexes, a stack of duplicate indexes, and, with the bugs fixed, simulation results showing 99.6% cost reduction for the obvious missing index on order_items.order_id. Exactly the kind of finding that makes a DBA tool worth having.
So - can you replicate a 4,000-line Python MCP server with custom tools in a YAML file? Yes. 1,668 lines of PL/pgSQL, covering regex-based SQL analysis, HypoPG simulation, and multi-tier graceful degradation. The constraint - running inside PostgreSQL instead of outside it - turned out to be a feature, not a limitation. Zero server-side dependencies. Drop in the YAML. Restart.
What's Next
The toolkit covers the CrystalDBA feature gap, but there's room to grow:
Multi-column index candidates. The regex extraction currently generates single-column candidates. Composite indexes (covering multiple WHERE columns or matching ORDER BY sequences) would improve Tier 2 recommendations.
Greedy selection refinement. The current Tier 2 evaluates each candidate independently. A full greedy loop - pick the best, keep it active, re-evaluate remaining candidates - would catch index interactions where adding one makes another redundant.
Additional toolkit packs. Security audit, migration helper, and monitoring packs could follow the same YAML drop-in pattern. The custom definitions system handles it.
Dynamic tool discovery. If the number of custom tools grows past 20-30, the three-tool pattern (search_tools, describe_tools, execute_tool) could replace static listing and cut token usage by 96%. Nowhere near that threshold today, but the architecture supports it.
Vibe-Coding Learnings
I said up top that Claude wrote the code. That's true. But "Claude wrote the code" undersells the amount of steering involved. Here's what I actually learned about using an AI coding agent for a project like this.
Architecture is your job. Claude will happily write 1,668 lines of PL/pgSQL, but it won't tell you to use custom tools instead of modifying the server core. It won't decide that three tools is better than seven. It won't pick the regex-over-pglast approach or design the two-tier degradation. Those are product and architecture decisions, and if you don't make them, you get whatever the agent's default instincts produce. Direct the what and the why. Let the agent handle the how.
You have to know what to look at. When I pointed Claude at CrystalDBA and said "tell me how the index tuner works," it came back with a clear breakdown of pglast, HypoPG, and the candidate-generation pipeline. But I had to know to ask. The agent doesn't go looking for comparable projects on its own. Competitive analysis is still a human skill.
Testing is where you earn your keep. Claude generated code that compiled, ran without errors, and produced plausible-looking output. It also had two silent bugs that meant the most important feature (HypoPG simulation) returned zero results. Everything looked right. The tool reported "tier": "simulation" and returned heuristic recommendations. Without testing against a real database with known-good data, I'd have shipped broken code with confidence. The agent can write tests, but you have to be the one who notices the output doesn't match reality.
Push back on the agent. Claude's first instinct on several occasions was wrong - suggesting approaches I had to reject, making changes I didn't ask for, or missing context I had from elsewhere in the project. The more domain knowledge you bring, the more useful the agent becomes. It's a force multiplier, not a replacement.
The bug you fix yourself hits different. During this project I found a genuine bug in the pgEdge server's custom tool execution, unrelated to the DBA toolkit, but surfaced by testing the toolkit against it. I had Claude diagnose the root cause and write the fix, then submitted the PR myself. Without Claude I'd have been flailing and pulling an engineer off real work to help me. Instead, product management found, diagnosed, and fixed a server bug without bothering anyone. That's new.
The whole project (research, design, implementation, debugging, testing) took about three days of evening sessions. Most of that time was me reading output, testing in the browser, and telling Claude what to fix. The ratio of my typing to Claude's typing was probably 1:50. The ratio of my decision-making to Claude's decision-making was the inverse.
Try It
Download pgedge-postgres-mcp-dba.yaml into your MCP server directory and add one line to your MCP server config:
custom_definitions_path: "pgedge-postgres-mcp-dba.yaml"Restart the server. The three tools appear in the tool list immediately. For get_top_queries, your database needs the pg_stat_statements extension enabled. For Tier 2 index simulation, install HypoPG. Both are optional - the tools degrade gracefully without them.
Once the tools are loaded, try these prompts:
"What are the slowest queries on this database?" - triggers
get_top_queries"Run a health check on this database" - triggers
analyze_db_health"Are there any missing indexes I should add?" - triggers
recommend_indexesTier 1 (heuristic)"Simulate which indexes would improve my top queries" - triggers
recommend_indexesTier 2 (HypoPG)
Links:
pgEdge Postgres MCP Server - GitHub | Documentation | Getting started
DBA Toolkit YAML - examples/pgedge-postgres-mcp-dba.yaml
pgEdge - pgedge.com | AI Toolkit