Scaling Postgres
Postgres has earned its reputation as one of the world's most robust and feature-rich open-source databases. But what happens when your application grows beyond what a single database instance can handle? When your user base explodes from thousands to millions, and your data grows from gigabytes to terabytes?
This is where Postgres scaling becomes critical. The good news is that Postgres offers multiple pathways to scale, each with its own advantages and use cases. Since pgEdge Distributed Postgres and pgEdge Enterprise Postgres are 100% Postgres, all of the scaling techniques that follow also apply to your pgEdge cluster.
In this comprehensive guide, we'll explore three fundamental scaling approaches:
vertical scaling (enhancing the power of your current server)
horizontal scaling (adding additional servers)
and high availability strategies (ensuring your system remains online in the event of failures).
Postgres Architecture
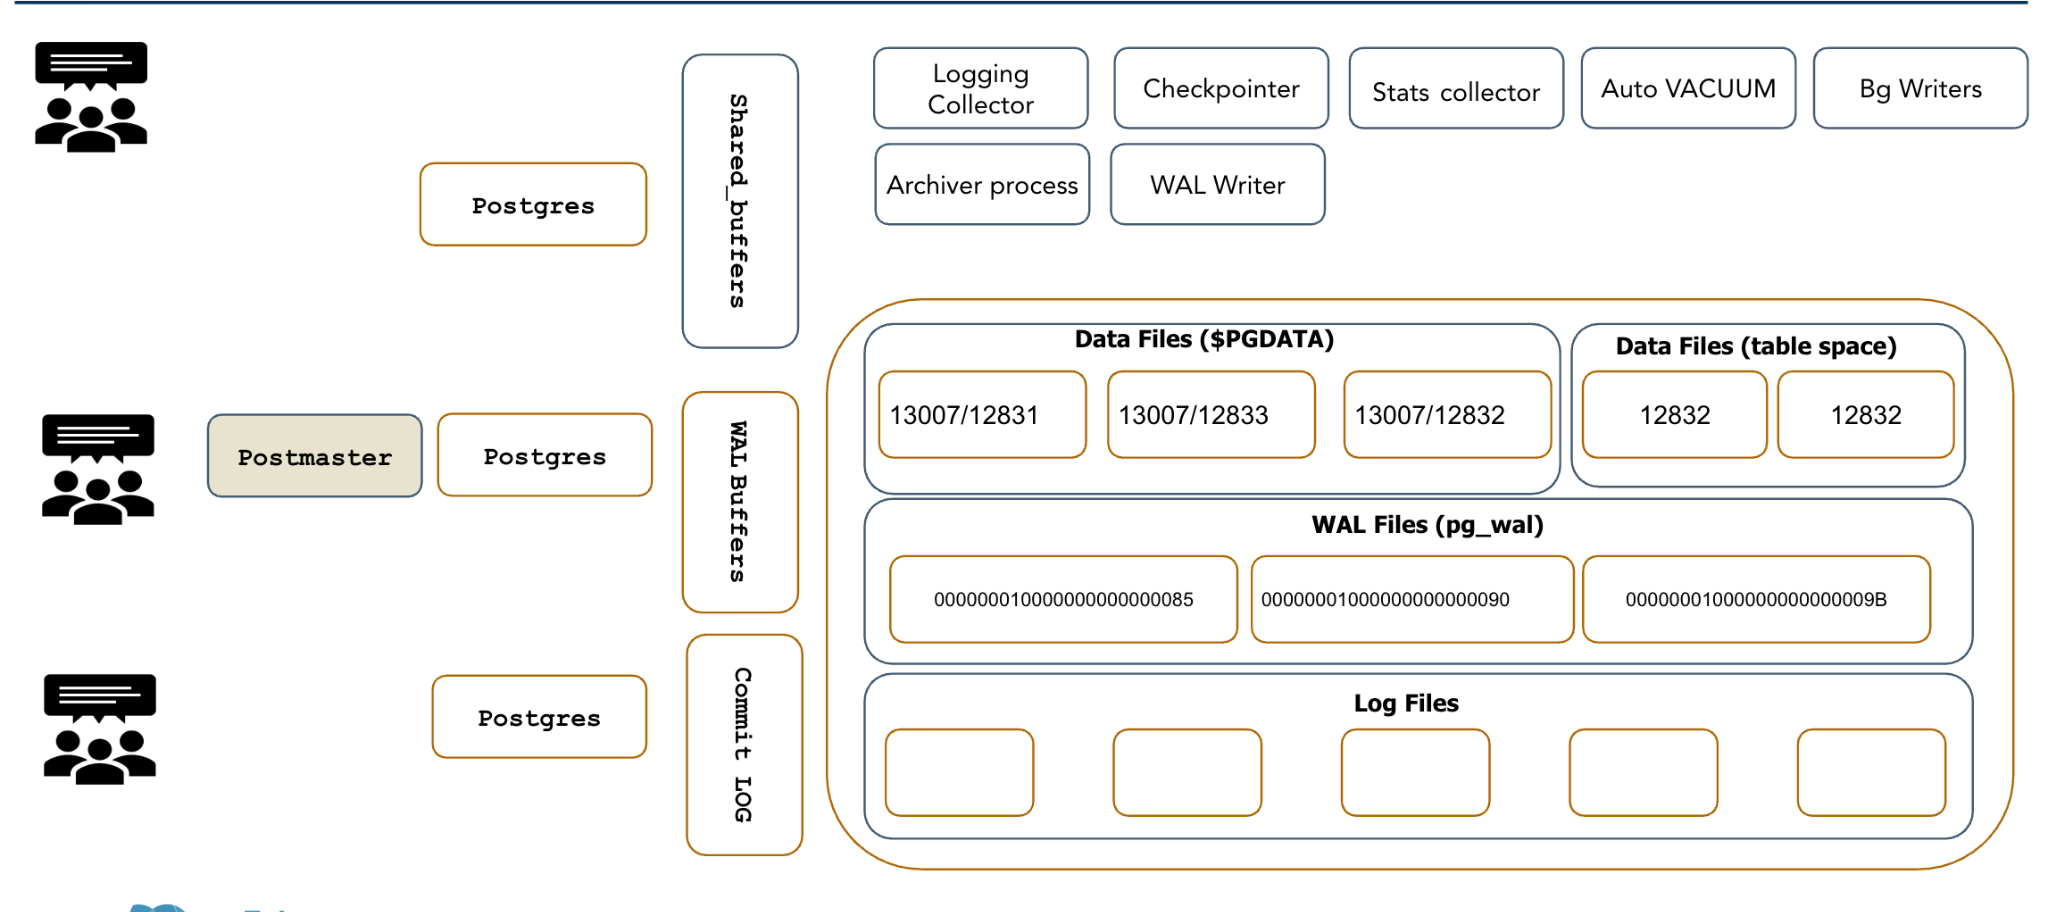
Before diving into scaling strategies, it's crucial to understand how Postgres works under the hood. Unlike some databases that use threads, Postgres uses a process-based architecture. This design choice has significant implications for how we approach scaling.
The Postgres Process Family
When Postgres runs, it creates several specialized processes, each with a specific job:
Postmaster: The master process that coordinates everything else
Backend processes: One for each client connection - they handle your SQL queries
WAL Writer: Manages the Write-Ahead Log, ensuring data durability
Checkpointer: Periodically flushes data from memory to disk
Background Writer: Smooths out disk I/O by gradually writing data
Autovacuum Workers: Clean up dead rows and maintain database health
Replication processes: Handle data copying to other servers
You can see these processes in action on any Postgres server:
$ ps -ef | grep postgres
54170 ?  00:00:00 postgres: postmaster
54172 ?  00:00:00 postgres: checkpointer
54173 ?  00:00:00 postgres: background writer
54174 ?  00:00:00 postgres: walwriter
54175 ?  00:00:00 postgres: autovacuum launcher
Understanding this architecture is crucial because each process can become a bottleneck, and each has its own set of tuning parameters. Effective scaling often starts by optimizing these individual components.
Vertical Scaling
Vertical scaling, also known as "scaling up," means getting the most performance possible from a single Postgres server. This is often the most cost-effective first step in any scaling journey.
Memory: The Foundation of Postgres Performance
Postgres's performance is heavily dependent on memory configuration. Getting these settings right can often double or triple your database performance without adding any hardware.
Shared Buffers: Your Database Cache
The shared_buffers parameter controls the amount of memory Postgres allocates for caching data pages. Think of it as Postgres's primary workspace. On a server with 64GB of RAM, you might set this to 16-24GB:
postgres=# ALTER SYSTEM SET shared_buffers='16GB';This means Postgres will keep 16GB worth of your most frequently accessed data in memory, dramatically reducing disk I/O for common queries.
Work Memory: Per-Operation Workspace
work_mem is allocated for each sort, join, or hash operation in your queries. This value can make an enormous difference for complex queries. This example shows the difference proper settings make when querying a real-world example with 11 million rows:
With insufficient work memory (2MB):
postgres=# SET work_mem='2MB';
postgres=# EXPLAIN ANALYZE SELECT * FROM large_table ORDER BY id;
-- Result: Sort Method: external merge Disk: 70208kB
-- Execution Time: 13,724 ms (nearly 14 seconds!)
With adequate work memory (1GB):
postgres=# SET work_mem='1GB';
postgres=# EXPLAIN ANALYZE SELECT * FROM large_table ORDER BY id;
-- Result: Sort Method: quicksort Memory: 916136kB
-- Execution Time: 7,757 ms (under 8 seconds)
The query runs almost twice as fast simply by avoiding disk spills during sorting.
Maintenance Work Memory: For Big Operations,
maintenance_work_mem affects operations like VACUUM, CREATE INDEX, and ALTER TABLE. Setting this higher can significantly speed up maintenance operations:
-- Before: 12.4 seconds to create index
postgres=# SET maintenance_work_mem='10MB';
postgres=# CREATE INDEX idx_foo ON large_table(id);
-- Time: 12374.931 ms

-- After: 9.6 seconds to create the same index
postgres=# SET maintenance_work_mem='1GB';
postgres=# CREATE INDEX idx_foo ON large_table(id);
-- Time: 9550.766 ms
Write-Ahead Log (WAL) Tuning: Balancing Safety and Speed
Postgres's WAL system ensures your data survives crashes, but it also affects performance. Understanding these trade-offs is crucial:
Synchronous Commit: The Safety vs Speed Trade-off
synchronous_commit=on (default): Safest option, but commits wait for WAL to be written to disk
synchronous_commit=off: Much faster, but you might lose a few seconds of data in a crash
Checkpoint Configuration: Managing I/O Spikes
A checkpoint is when Postgres flushes modified data to disk. Checkpoints are necessary for crash recovery, but they can cause performance spikes:
-- Longer checkpoint intervals improve performance but increase crash recovery time
postgres=# ALTER SYSTEM SET checkpoint_timeout='30min';
postgres=# ALTER SYSTEM SET max_wal_size='10GB';
Storage: The Often-Overlooked Foundation
No amount of memory tuning can overcome slow storage. Postgres's MVCC (Multi-Version Concurrency Control) system means each update creates a new row version rather than overwriting existing ones. This makes fast storage absolutely critical for write-heavy workloads.
Storage hierarchy impact:
NVMe SSDs: Excellent for all workloads
SATA SSDs: Good for most applications
Traditional HDDs: Acceptable only for read-heavy workloads or small databases
Horizontal Scaling: Adding More Servers to the Mix
When a single server reaches its limits, horizontal scaling distributes the workload across multiple machines. Postgres offers several approaches to achieve this.
A robust cluster, architected across multiple availability zones that uses the Spock extension to ensure data consistency is a dependable way to ensure data consistency and performance.
Read Replicas: Scaling Read Operations
Streaming replication allows you to create read-only copies of your primary database. This type of scaling is perfect for applications with heavy read workloads.
Setting up streaming replication:
1. On the primary server, create a replication user:
postgres=# CREATE ROLE replicator WITH REPLICATION LOGIN PASSWORD 'secure_password';2. Configure access in pg_hba.conf
host replication replicator 10.0.0.2/32 md53. On the replica server, create the replica:
$ pg_basebackup -h 10.0.0.1 -D /var/lib/postgresql/15/main -U replicator -P -RIt's that simple to create a read replica that stays synchronized with your primary database. Your application can send read queries to the replica, reducing the load on the primary.
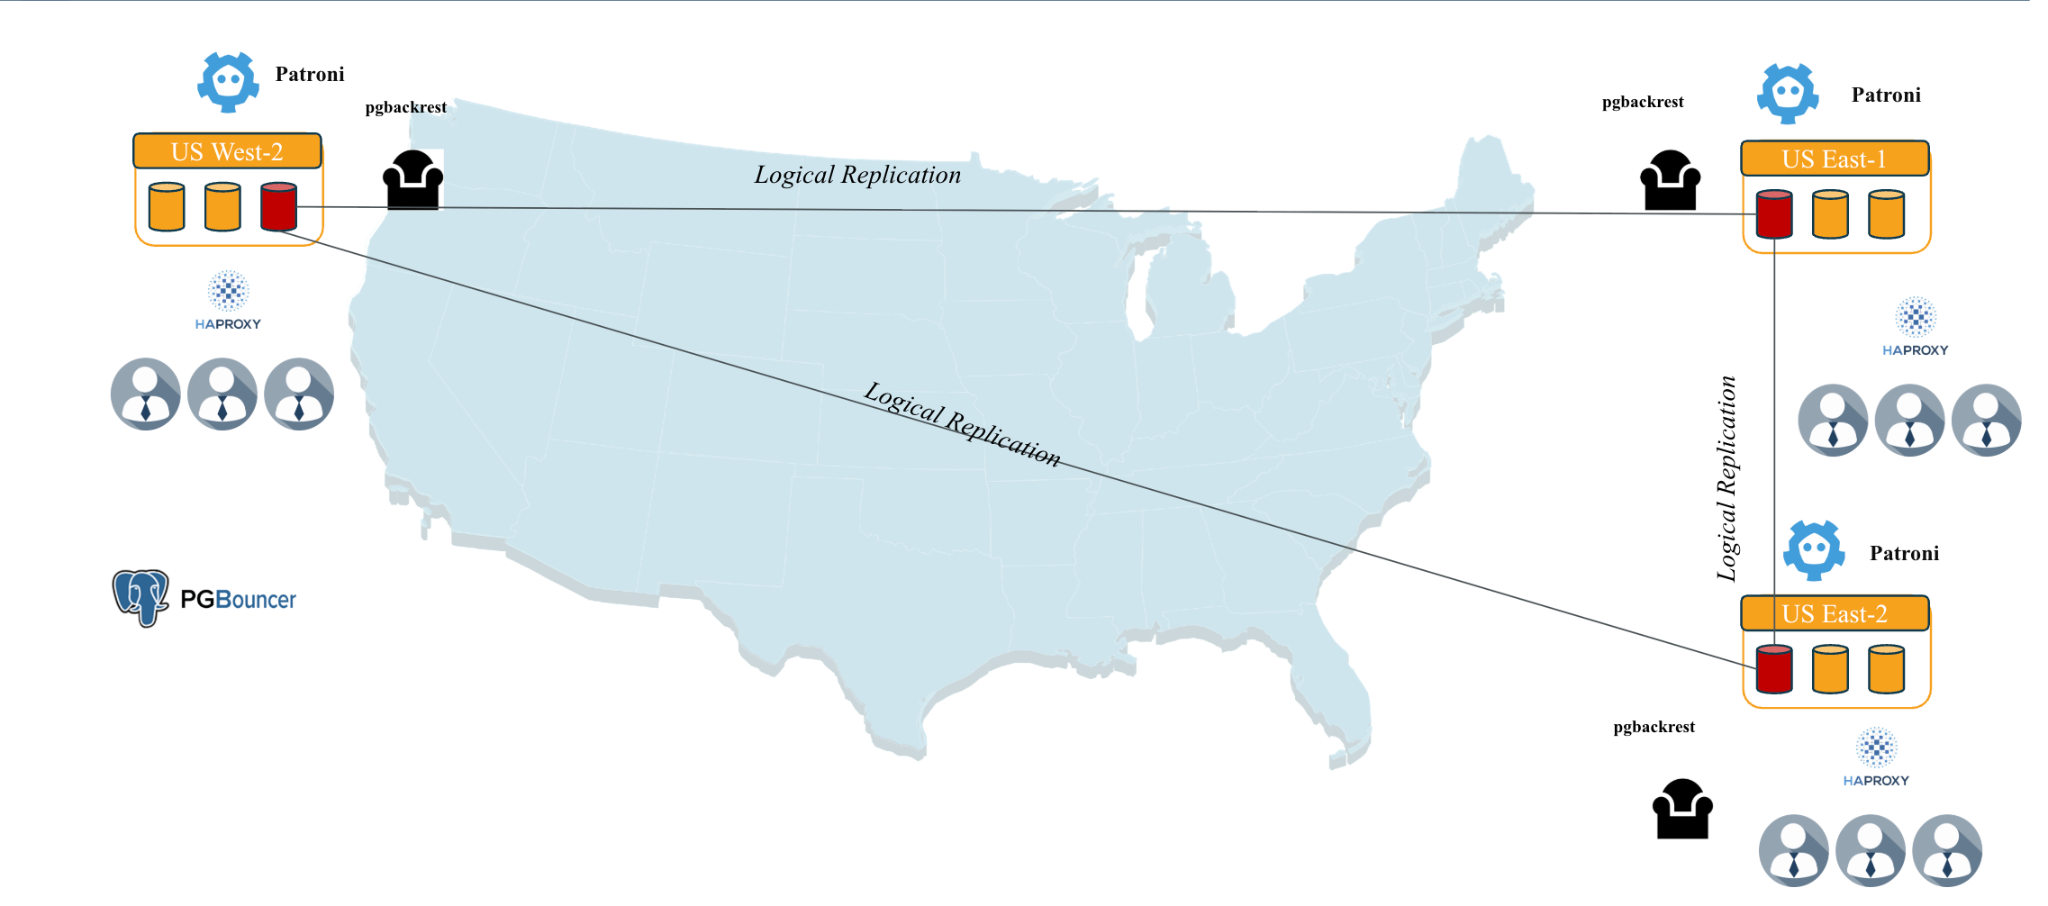
Logical Replication: Selective Data Distribution
Unlike streaming replication, which copies everything, logical replication lets you choose precisely what to replicate. This is incredibly useful for:
Microservices: Each service gets only the data it needs.
Reporting databases: Replicate only those tables needed for analytics.
Data migration: You can gradually move specific tables to new systems.
Example setup:
-- On the source database
postgres=# CREATE PUBLICATION sales_pub FOR TABLE customers, orders, products;

-- On the destination database
postgres=# CREATE SUBSCRIPTION sales_sub
  CONNECTION 'host=source.db.com dbname=main user=replicator'
  PUBLICATION sales_pub;
Table Partitioning: Divide and Conquer Large Tables
Partitioning splits large tables into smaller, more manageable pieces. This is especially effective for time-series data or geographically distributed data.
Example: Partitioning sales data by month:
CREATE TABLE sales (
    id bigserial,
    sale_date date NOT NULL,
    amount numeric,
    customer_id bigint
) PARTITION BY RANGE (sale_date);

CREATE TABLE sales_2024_01 PARTITION OF sales
    FOR VALUES FROM ('2024-01-01') TO ('2024-02-01');

CREATE TABLE sales_2024_02 PARTITION OF sales
    FOR VALUES FROM ('2024-02-01') TO ('2024-03-01');
Now when you query for January sales, Postgres only examines the January partition, dramatically reducing query time.
Sharding: The Ultimate Scale-Out Strategy
For truly massive datasets, sharding distributes different rows across different servers. For example, a ride-sharing app might use a dataset that is sharded by city:
Server 1: All New York trips
Server 2: All London trips
Server 3: All Tokyo trips
pgEdge Enterprise Postgres and pgEdge Distributed Postgres provide a cluster environment that allows you to seamlessly add and remove cluster nodes as needed from an Active-Active distributed cluster. This lets you achieve the maximum benefit from sharding your cluster with the Spock extension.
Other extensions like Citus make sharding more manageable by providing a distributed query engine that can join data across shards, but the Spock extension adds support to help you meet international data residency requirements, data consistency checks to prevent transaction conflicts, and functions and procedures that refine management tasks.
High Availability: Keeping Your Database Online
Scaling for performance means nothing if your database goes down. High availability ensures your system stays online even when individual components fail.
Automated Failover: When the Primary Goes Down
Automated failover ensures high availability in Postgres clusters by swiftly transitioning to a new primary server when the original fails. Tools like Patroni orchestrate this process, minimizing downtime to seconds. Here’s an expanded overview of the failover sequence:
Primary Server Fails: The primary Postgres server becomes unavailable due to hardware issues, network failures, or crashes. Patroni monitors the cluster via health checks and a distributed consensus system (e.g., etcd). If the primary stops renewing its leader key in the consensus store within a set timeout (e.g., 10 seconds), it’s flagged as down. Network partitions are mitigated to prevent false positives, ensuring the old primary is fenced off to avoid data conflicts.
Patroni Detects the Failure: Patroni nodes, communicating through a Distributed Configuration Store (DCS), confirm the primary’s failure when its leader key expires. Configuration settings like ttl and loop_wait determine detection speed, balancing responsiveness with stability to avoid premature failovers.
Patroni Promotes the Best Replica: Patroni selects a replica based on minimal replication lag, node health, and configured priorities. The chosen replica is promoted to primary using Postgres’s pg_promote command, and the DCS is updated to reflect the new leader. Other replicas reconfigure to follow the new primary.
Applications Reconnect: Applications use connection pooling (e.g., PgBouncer) or updated DNS to reconnect to the new primary. Patroni ensures a smooth transition by maintaining consistent connection details.
Failed Server Rejoins: The failed server is rebuilt, often using tools like pg_rewind to synchronize it with the new primary, then rejoins as a replica.
Load Balancing: Distributing Traffic Intelligently
Load balancing enhances the performance and scalability of Postgres clusters by intelligently distributing database traffic across servers. Tools like HAProxy and pgpool-II manage this process, directing write queries to the primary server and distributing read queries across replicas to optimize resource utilization and reduce latency.
HAProxy is a high-performance TCP/HTTP load balancer that routes queries based on connection details or application-layer information. It sends write queries (e.g., INSERT, UPDATE) to the primary server, identified via integration with tools like Patroni, which updates HAProxy’s configuration to track the current primary. Read queries (e.g., SELECT) are distributed across replicas to leverage their processing power, using strategies like round-robin or least-connections to balance the load. HAProxy can inspect query metadata to route traffic based on user, database, or query type, enabling fine-grained control (e.g., sending reporting queries to specific replicas).
pgpool-II, explicitly designed for Postgres, offers similar functionality with native database integration. It parses queries to direct writes to the primary and spreads reads across replicas, supporting session-based routing for consistent user experiences. It also offers advanced features, including connection pooling and query caching, to minimize database load. Both tools integrate seamlessly with Patroni-managed clusters, using health checks or DCS updates to detect the current primary and avoid routing to failed nodes.
Postgres Connection Pooling: Managing High Concurrency
Connection pooling is a crucial tool for any active PostgreSQL application. Postgres spawns a new process for each connection, leading to high resource consumption when under heavy loads. Connection poolers address this need by multiplexing many client connections over a smaller number of database connections, significantly reducing overhead and improving scalability and performance. For instance, a pooler could manage 5,000 application connections using just 100 Postgres processes.
Some key connection poolers:
PgBouncer:
Focus: A lightweight, single-threaded, C-based pooler designed for efficient connection pooling.
Features: Supports session, transaction, and statement pooling modes for optimal connection reuse, with minimal overhead (one process).
Strengths: Ideal for high-connection scenarios, easily integrates with Patroni for failover. Benchmarks often show superior transaction per second (TPS) performance compared to Pgpool-II. Simple to set up.
Limitations: Lacks built-in load balancing, requiring multiple instances for scaling.
Use Case: Primarily for pure connection pooling in high-availability (HA) setups.
Pgpool-II:
Focus: A comprehensive, C-based, multi-process middleware offering pooling, load balancing (for read replicas), replication, and failover capabilities.
Features: Parses queries for intelligent read/write splitting and includes query caching.
Strengths: An all-in-one solution for HA clusters, effectively managing standby reads.
Limitations: Higher overhead (defaulting to 32 child processes) and requires careful tuning for optimal pooling. Misconfiguration can lead to performance degradation (e.g., lower TPS in benchmarks).
Use Case: Best suited for complex setups that require query routing and advanced features beyond basic pooling.
Other Notable Poolers:
PgCat (Rust, multi-threaded): A modern, PgBouncer-compatible alternative that includes load balancing, automatic sharding (key detection), and failover. Known for consistent performance and low latency at scale, making it excellent for distributed/sharded Postgres environments and capable of handling over 100K queries per second in production.
Odyssey (C, multi-threaded): Developed by Yandex, this scalable pooler utilizes asynchronous coroutines, supports TLS, various authentication methods (PAM/LDAP), and prevents stale reads. It handles high loads efficiently and supports transaction pooling for prepared statements, making it suitable for cloud and large-core systems.
Supavisor (Elixir): A cloud-native solution designed for millions of connections, offering zero-downtime scaling for serverless environments. It provides competitive performance comparable to PgBouncer and PgCat, and is used as a replacement for PgBouncer in Supabase.
Pgagroal: A multi-threaded pooler focused on performance, similar to Odyssey but with a lighter feature set.
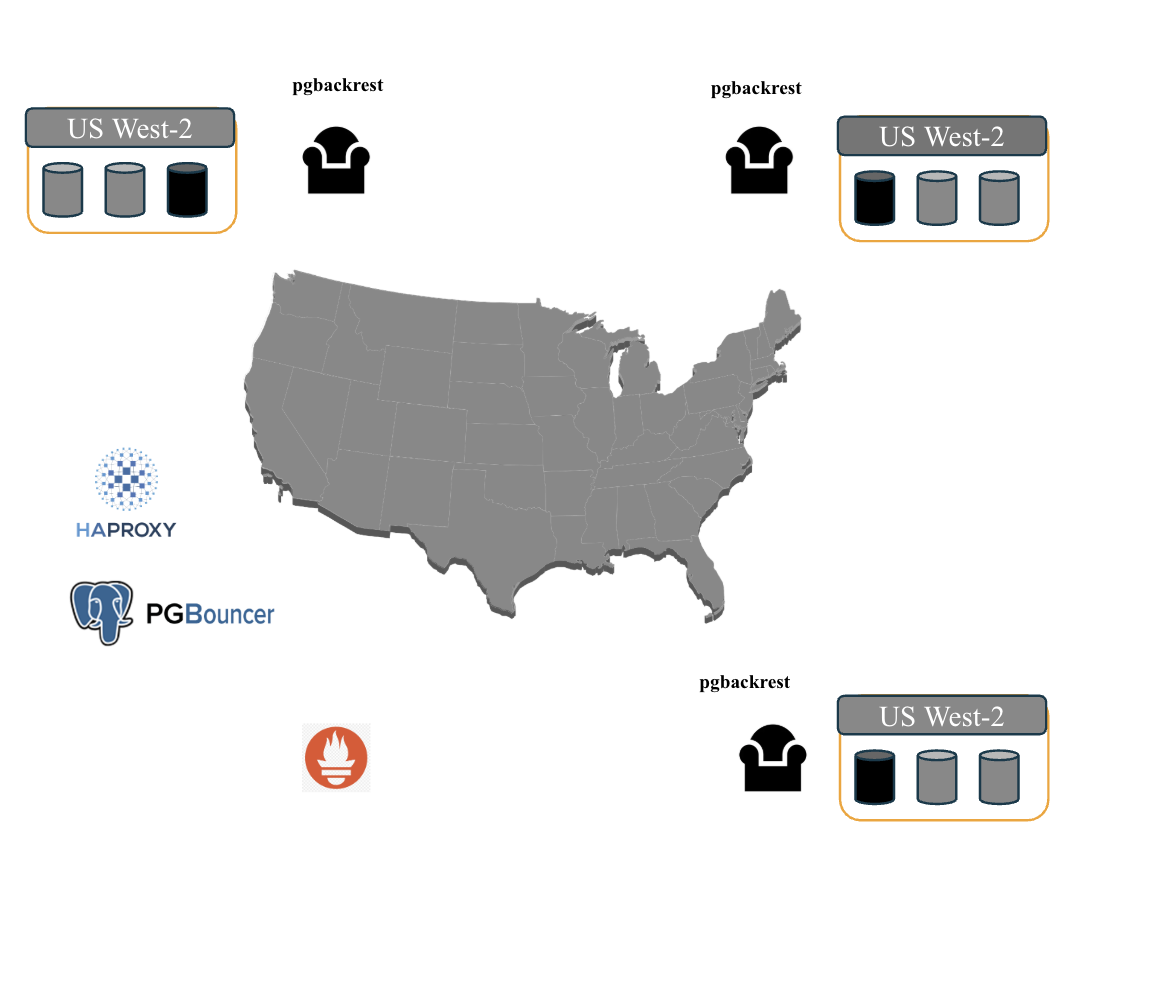
Backup and Recovery: Your Safety Net
Point-in-Time Recovery (PITR) with tools like pgBackRest allows you to recover your database to any point in time:
# Recover to exactly 10 minutes before the accident
pgbackrest restore --stanza=main --target="2024-09-16 14:30:00" --type=timeThis is invaluable when someone accidentally drops a table or corrupts important data.
A Real-World Scaling Journey
Let's follow a typical application through its scaling evolution:
Stage 1: Single Server (0-100 users)
Setup: One Postgres server with properly tuned memory settings
Focus: Optimize
shared_buffers,work_mem, and upgrade to SSD storageCapacity: Handles moderate read/write loads comfortably
Stage 2: Read Replicas (10,000-100,000 users)
Addition: Two read replicas to handle growing query load
Benefit: Read queries distributed across three servers
New capability: Separate reporting queries from transactional workload
Stage 3: Partitioning (driven by data size and usage)
Challenge: Historical data tables are becoming too large
Solution: Partition large tables by date or category
Result: Queries on recent data remain fast despite growing archive
Stage 4: High Availability (meeting SLA/RTO/RPO requirements)
Requirements: 99.9% uptime becomes business-critical
Implementation: Patroni for automatic failover, load balancing, and comprehensive monitoring
Confidence: System survives server failures with minimal disruption
Stage 5: Advanced Scaling (when you have Millions of users)
Options: Sharding with Citus, multiple database clusters, global distribution
Architecture: Complex but handles massive scale
Monitoring: Your Crystal Ball
Effective scaling requires visibility into your database performance. Key metrics to monitor:
Connection counts: Track whether you're nearing
the maximum number of connections.Replication lag: Ensure your replicas are keeping pace.
Checkpoint timing: Identify if checkpoints are causing performance spikes.
Query Performance: Pinpoint your slowest queries.
Disk usage: Monitor for dwindling storage space.
Tools like Prometheus and Grafana offer real-time dashboards for comprehensive oversight, while pg_stat_statements is invaluable for identifying underperforming queries.
Future-Proofing Your Postgres Architecture
Postgres continues to evolve rapidly, providing:
Improved partitioning: Better query pruning and automatic partition management
Enhanced logical replication: More granular control and better conflict resolution
Cloud-native features: Better integration with Kubernetes and cloud platforms
Distributed extensions: Extensions like Citus and pgEdge bring distributed database capabilities
Conclusion
Successful Postgres scaling is not about implementing every technique at once. It's about:
Starting with vertical scaling: Proper tuning can easily provide 2-5x performance improvements.
Adding horizontal scaling gradually: Begin with read replicas, then partition your content, then shard data as needed.
Never forgetting high availability: Automated failover and backups are essential.
Monitoring everything: You can't optimize what you can't measure.
Planning for growth: Design your architecture to evolve with your application.
pgEdge is passionate about performance; Postgres's flexibility means you're never locked into a single scaling approach with your pgEdge Enterprise Postgres or pgEdge Distributed Postgres cluster. You can start simple and gradually add complexity as your needs grow. With proper planning and implementation, your cluster can scale from a small startup's first database to a global platform serving millions of users.
The key is to initiate your scaling journey early, before a performance issue becomes a critical business problem. By understanding these strategies and implementing them thoughtfully, you'll be prepared to handle whatever growth your application requires.
Thinking about watching the webinar in full? It’s recorded - find it here.