AI Features in pgAdmin: AI Insights for EXPLAIN Plans
This is the third and final post in a series covering the new AI functionality in pgAdmin 4. In the first post, I covered LLM configuration and the AI-powered analysis reports, and in the second, I introduced the AI Chat agent for natural language SQL generation. In this post, I'll walk through the AI Insights feature, which brings LLM-powered analysis to PostgreSQL EXPLAIN plans.
Anyone who has spent time optimising PostgreSQL queries knows that reading EXPLAIN output is something of an acquired skill. pgAdmin has long provided a graphical EXPLAIN viewer that makes the plan tree easier to navigate, along with analysis and statistics tabs that surface key metrics, but interpreting what you're seeing and deciding what to do about it still requires a solid understanding of the query planner's behaviour. The AI Insights feature aims to bridge that gap by providing an expert-level analysis of your query plans, complete with actionable recommendations.
Where to Find It
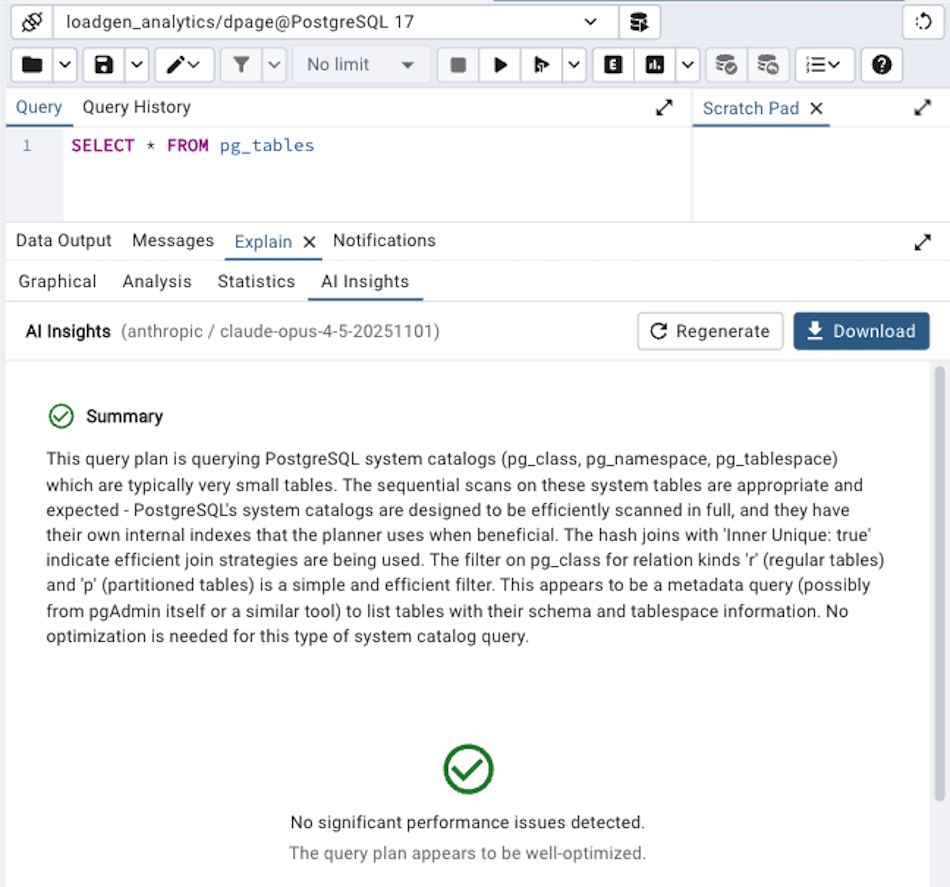
AI Insights appears as a fourth tab in the EXPLAIN results panel, alongside the existing Graphical, Analysis, and Statistics tabs. It's only visible when an LLM provider has been configured, so if you don't see it, check that you've set up a provider in Preferences (as described in the first post). The tab header simply reads 'AI Insights'.
To use it, run a query with EXPLAIN (or EXPLAIN ANALYZE for the most useful results, since actual execution timings give the AI much more to work with), and then click on the AI Insights tab. The analysis starts automatically when you switch to the tab, or you can trigger it manually with the Analyze button.
 What the Analysis Provides
The AI Insights analysis produces three sections:
Summary
A concise paragraph providing an overall assessment of the query plan's performance characteristics. This gives you a quick sense of whether the plan is generally healthy or has significant issues worth investigating. For well-optimised queries, the summary will confirm that the plan looks reasonable; for problematic ones, it highlights the key areas of concern.
Performance Bottlenecks
This is the heart of the analysis. The AI examines the plan tree and identifies specific nodes that may be causing performance problems. Each bottleneck is presented as a card showing:
Severity: Classified as high, medium, or low, with colour-coded indicators (red for high, orange for medium, blue for low) so you can quickly spot the most important issues
Node: The specific plan node involved (for example, 'Seq Scan on orders' or 'Nested Loop')
Issue: A brief description of the problem
Details: A more thorough explanation of why this is a problem and what impact it has on query performance
The types of issues the analysis looks for include sequential scans on large tables where an index might help, nested loops with high row counts that suggest missing indexes or poor join ordering, large variances between estimated and actual row counts (which usually indicate stale statistics), sort operations on large datasets without supporting indexes, hash joins spilling to disk, and bitmap heap scans with excessive recheck conditions.
Importantly, the analysis also applies contextual judgement. Not every sequential scan is a problem; scanning a small lookup table sequentially is often faster than using an index, and the AI takes table size and selectivity into account when deciding whether to flag something as an issue.
Recommendations
Each identified bottleneck comes with one or more prioritised recommendations for addressing it. Recommendations are numbered by priority, with the most impactful changes listed first. Each recommendation includes:
Title: A short description of the suggested change
Explanation: Why this change will help, connecting the recommendation back to the specific bottleneck
SQL: Where applicable, the exact SQL statement to implement the recommendation
This last point is particularly valuable. Rather than telling you "consider adding an index" and leaving you to work out the details, the analysis provides the actual CREATE INDEX statement with the appropriate table name, column list, and index type. Each SQL code block has a copy button and an 'Insert into Editor' button that places the SQL directly into your query editor, so you can review and execute it with minimal friction.
Recommendations aren't limited to index creation, however. You might see suggestions to run ANALYZE on tables with stale statistics, to adjust work_mem for queries that are spilling sorts or hash operations to disk, to rewrite suboptimal query structures, or to consider partial indexes when a full index would be unnecessarily large.
A Worked Example
To give a sense of what this looks like in practice, imagine you run EXPLAIN ANALYZE on a query that joins a large orders table with a customers table and filters by date range. The AI Insights analysis might produce something like this:
Summary: The query takes 2.3 seconds to execute, with the majority of time spent on a sequential scan of the orders table. The join to customers is well-optimised using an index lookup, but the date range filter on orders is not supported by an index, causing a full table scan of 4.2 million rows.
Bottleneck (High Severity): Sequential Scan on orders, scanning 4,200,000 rows but returning only 12,500. The planner estimated 15,000 rows, suggesting statistics are reasonably up to date, but the lack of an index forces a full scan.
Recommendation 1: Create an index on the date column:
CREATE INDEX idx_orders_order_date ON orders (order_date);Recommendation 2: If queries typically also filter by status, consider a composite index:
CREATE INDEX idx_orders_date_status ON orders (order_date, status);You could click 'Insert into Editor' on either recommendation, review the statement, execute it, and then re-run your EXPLAIN ANALYZE to see the improvement.
Downloading Reports
If you want to save or share the analysis, the Download button exports a complete Markdown report including the original SQL query, the raw execution plan, and the full AI analysis with all bottlenecks and recommendations. The file is named with the current date (for example, query-plan-insights-2026-02-18.md) for easy filing.
Regenerating and Stopping
Because LLM responses can vary between invocations, you might occasionally want to get a second opinion on the same plan. The Regenerate button reruns the analysis from scratch, which can sometimes surface different insights or provide alternative recommendations. If a new EXPLAIN is run whilst the AI Insights tab is visible, the analysis will automatically trigger for the new plan.
If the analysis is taking longer than expected (the timeout is five minutes, though most analyses complete in well under a minute), you can click the Stop button to cancel the in-flight request. The panel will show an 'Analysis stopped' message and you can choose to retry or move on.
How It Works Under the Hood
When you trigger an analysis, the frontend sends the full EXPLAIN plan (in JSON format) and the original SQL query to a backend endpoint via a streaming HTTP request. The backend constructs a prompt that instructs the LLM to act as a PostgreSQL performance expert, providing it with detailed guidelines on what to look for in query plans and how to classify severity. The LLM's response is parsed as structured JSON (with bottlenecks, recommendations, and summary as separate fields), which allows the frontend to render each piece with appropriate formatting and interactivity.
The streaming architecture means you see a 'thinking' indicator whilst the analysis is in progress, with rotating messages such as 'Analyzing query plan...', 'Examining node costs...', 'Looking for sequential scans...', and 'Evaluating join strategies...'. Results appear as soon as the LLM completes its response, without needing to reload or poll.
Getting the Most from AI Insights
A few suggestions for making the most of this feature:
Use EXPLAIN ANALYZE rather than plain EXPLAIN. The actual execution timings and row counts give the AI significantly more information to work with. Plain EXPLAIN provides only the planner's estimates, which limits the depth of analysis possible.
Don't blindly apply every recommendation. The AI provides excellent starting points, but you should consider your specific workload patterns before creating indexes. An index that helps one query might slow down write-heavy operations on the same table. Use the recommendations as informed suggestions that merit testing rather than directives to follow without question.
Use it as a learning tool. Even if you're already experienced with EXPLAIN output, the detailed explanations of why specific plan nodes are problematic can help reinforce your understanding or occasionally highlight something you might have overlooked. For less experienced users, it's an excellent way to build up familiarity with how PostgreSQL executes queries.
Combine it with the AI Chat agent. If the AI Insights analysis identifies issues but you want to explore further (perhaps to understand your data distribution or check current index usage statistics), switch to the AI Chat agent and ask follow-up questions. The two features complement each other well.
Wrapping Up the Series
Across these three posts, I've covered the full range of AI functionality now available in pgAdmin 4: the LLM configuration that underpins everything, the AI-powered security, performance, and schema design reports for proactive database analysis, the AI Chat agent for natural language SQL generation and database exploration, and the AI Insights feature for query plan optimisation.
All of these features are designed to enhance rather than replace your expertise. They lower the barrier to performing analyses that would otherwise require significant time and specialist knowledge, whilst keeping you firmly in control of what actually gets executed against your database. Whether you use a cloud-hosted model from Anthropic or OpenAI, or prefer to keep everything local with Ollama or Docker Model Runner, the AI features adapt to your environment and preferences.
Give them a try; I think you'll find they become a natural part of your PostgreSQL workflow. And as always, we welcome feedback and contributions from the community.