Checkpoints, Write Storms, and You
Every database has to reconcile two uncomfortable truths: memory is fast but volatile, and disk is slow but durable. Postgres handles this tension through its Write-Ahead Log (WAL), which records every change before it happens. But the WAL can't grow forever. At some point, Postgres needs to flush all those accumulated dirty pages to disk and declare a clean starting point. That process is called a checkpoint, and when it goes wrong, it can bring throughput to its knees.
A Bit About Checkpoints
Under normal operation, Postgres is remarkably polite about checkpoints. The checkpoint_timeout parameter (default 5 minutes) tells Postgres how often to perform a scheduled checkpoint, and checkpoint_completion_target (default 0.9) tells it to spread the resulting writes over 90% of that interval. So a checkpoint timeout of 5 minutes means Postgres trickles dirty pages to disk over roughly 4.5 minutes, keeping IO impact to a minimum.
This only applies to timed checkpoint behavior.
The max_wal_size parameter sets a soft limit on how much WAL can accumulate between checkpoints. When the WAL approaches that threshold (1GB by default), Postgres doesn't wait for the next scheduled checkpoint. Instead, it forces one immediately.
These forced (or requested) checkpoints do not honor checkpoint_completion_target. Postgres needs to reclaim WAL space, so it flushes every dirty buffer to disk as fast as the IO subsystem will allow. On a busy system with a large shared_buffers pool full of modified pages, this can completely saturate disk IO in seconds.
It's like trying to drink from a firehose.
Rubber Meets the Road
To see this in action, we set up a modest test environment:
Hypervisor: Proxmox
CPU: 4x AMD EPYC 9454 cores
RAM: 4GB
DB Storage: 100GB @ 2,000 IOPS
WAL Storage: 100GB @ 2,000 IOPS
OS: Debian 12 Bookworm
We initialized the database with pgbench at a scale factor of 800, producing roughly 12GB of data (3x available RAM to reduce cache hits). We also followed the traditional advice of setting shared_buffers to 25% of RAM, or 1GB in this case. All other settings remained at their defaults.
Each test followed the same pattern: issue a manual CHECKPOINT to start clean, then run pgbench for 60 seconds with per-second progress reporting and 16 concurrent clients to keep all of the CPU cores busy:
pgbench --progress=1 --time=60 --clients=16 demoWe started with the default max_wal_size of 1GB to see how the system behaves. This setting is frequently overlooked during optimization, so it should illustrate a good example of baseline operation.
Throughput holds steady between 1,000 and 1,100 TPS for the first 41 seconds of the test. Buffers began to warm, the IO subsystem was keeping pace, and latency remained low. At the 42-second mark, WAL output reached 1GB and Postgres forced a checkpoint. TPS immediately cratered to roughly 620—a drop of nearly 40%! It never recovered for the remainder of the benchmark run.
We increased max_wal_size to 4GB for the second test. It's a modest bump, but should be sufficient for the purposes of this demonstration. Throughput started around 1,000 TPS this time around and gradually climbed as shared buffers warmed up, reaching 1,200 TPS by the end of the test. One minute of pgbench activity isn’t enough to produce 4GB of WAL on this hardware, meaning no forced checkpoint.
The results basically speak for themselves: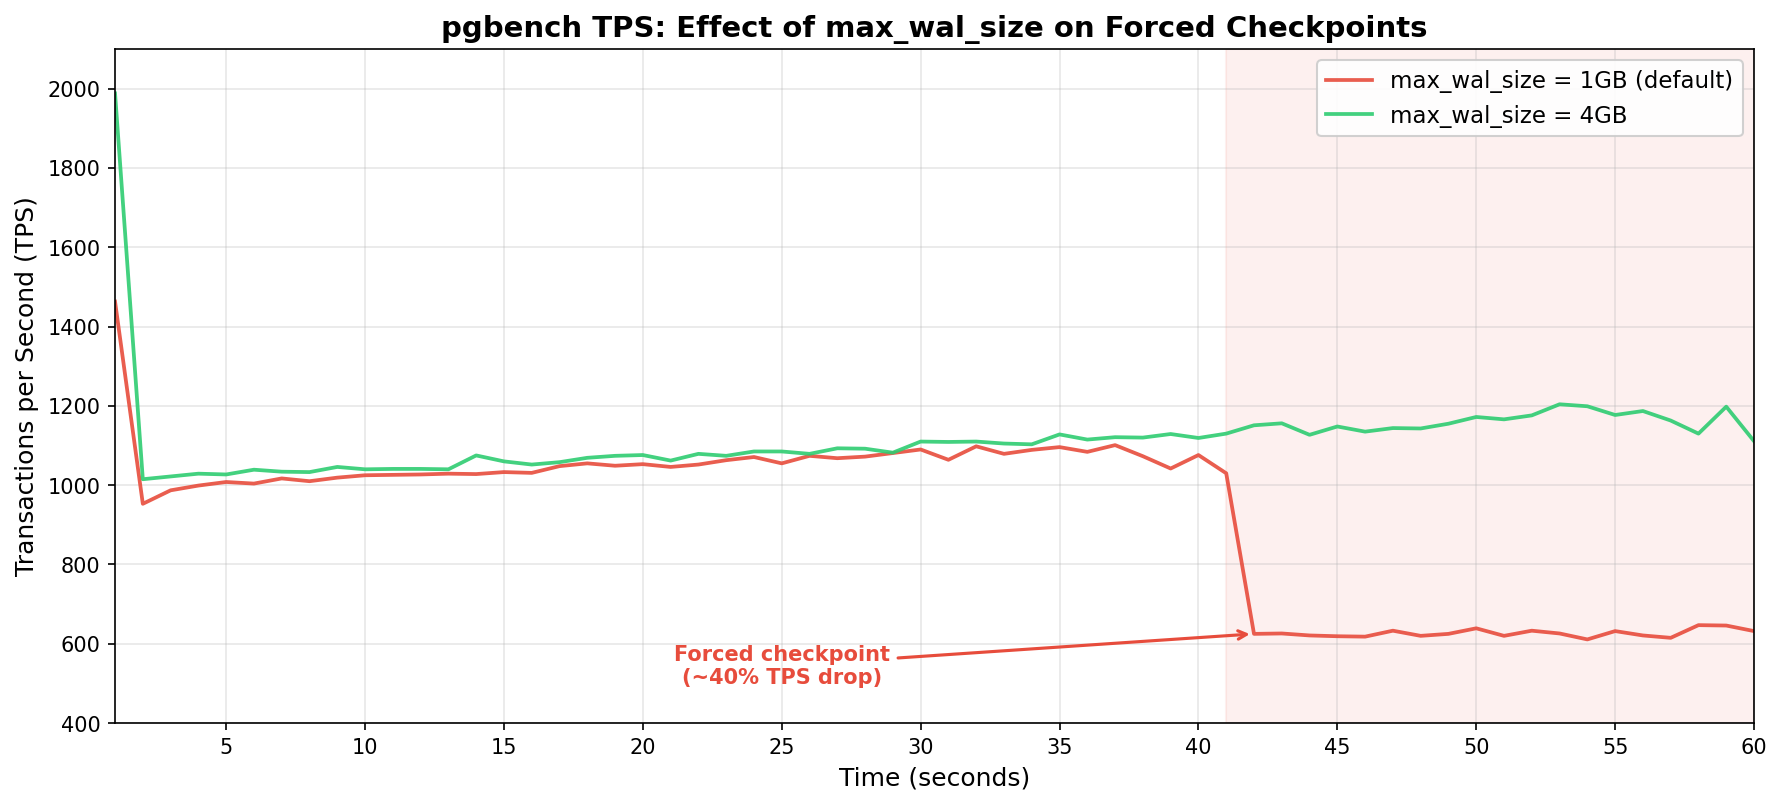 Ouch! Both tests tracked nearly identically for the first 40 seconds. Then the 1GB configuration hit a wall while the 4GB configuration kept climbing.
The Cost of Forced Checkpoints
Postgres normally uses checkpoint_completion_target during a timed checkpoint to calculate a write budget. If it has 5 minutes between checkpoints and the target is 0.9, it can spread dirty page writes over 270 seconds. That's a lot of time to trickle data to disk, and the IO impact per second is minimal.
A forced checkpoint has no such luxury. The WAL is full (or nearly so), and Postgres needs to reclaim space now. It writes dirty buffers as fast as it can, competing directly with active queries for disk IO. This competition is fierce on a system limited to 2,000 IOPS. Every IOPS spent flushing checkpoint data is essentially stolen from user queries.
The severity is largely hardware dependent. Systems with fast NVMe storage and tens (or hundreds) of thousands of IOPS may barely notice. But cloud instances, virtualized environments, or anything with IO throttling (which is extremely common) will feel the pain. We provisioned our test system at 2,000 IOPS per volume, which is relatively generous by cloud standards, and still experienced a marked impact.
The benchmark itself is only half of the story. Prior to that, we had to initialize the 12GB test database with pgbench --initialize. While pgbench generated the sample data with the default 1GB max_wal_size, Postgres triggered 18 forced checkpoints. Trying again with max_wal_size set to 20GB brought that number to zero.
So what? It's just initialization, right? Consider that this same pattern applies to any bulk data operation: COPY imports, large INSERT INTO ... SELECT statements, CREATE INDEX on big tables, REINDEX, or even hefty UPDATE batches. If any of these operations are running alongside a production OLTP workload, that's 18 IO storms competing with application queries.
An ETL job that loads a few gigabytes of data every night could trigger a string of forced checkpoints that spike latency for every other query on the system. The bulk operation itself will also slow down since it's fighting its own checkpoint IO for disk bandwidth.
Everyone loses when checkpoints can't spread write activity.
Spotting the Problem
Postgres tracks checkpoint statistics, and checking them should be part of any regular health assessment. The system catalog you should use depends on the Postgres version.
In Postgres 17 and later, use pg_stat_checkpointer:
SELECT num_timed, num_requested, num_done,
       write_time, sync_time, buffers_written
  FROM pg_stat_checkpointer;
In older versions, the same information lives in pg_stat_bgwriter:
SELECT checkpoints_timed, checkpoints_req,
       checkpoint_write_time, checkpoint_sync_time,
       buffers_checkpoint
  FROM pg_stat_bgwriter;
The critical ratio here is: timed versus requested checkpoints. In a well-tuned system, num_requested (or checkpoints_req) should be close to zero relative to num_timed. If requested checkpoints are a significant proportion of the total, max_wal_size is too small for the current write workload and performance is likely sub-optimal.
It's also worth keeping an eye on write_time and sync_time. If sync_time is consistently high, the storage subsystem is struggling to keep up with checkpoint flushes, which further confirms an IO bottleneck during checkpoints.
As for logging, we highly recommend setting log_checkpoints to on to capture checkpoint activity:
log_checkpoints = onThis causes Postgres to log detailed information about every checkpoint, such as the number of buffers written, how long it took including sync time, and other useful metrics. When enabled, the Postgres log should show checkpoint activity like this:
LOG:  checkpoint starting: wal
LOG:  checkpoint complete: wrote 2069 buffers (1.6%), wrote 2 SLRU buffers;
      0 WAL file(s) added, 1 removed, 32 recycled; write=2.132 s, sync=0.092 s,
      total=2.282 s; sync files=35, longest=0.090 s, average=0.003 s;
      distance=553713 kB, estimate=553713 kB; lsn=6/FEBDB228,
      redo lsn=6/DFFFFC60
LOG:  checkpoints are occurring too frequently (2 seconds apart)
HINT:  Consider increasing the configuration parameter "max_wal_size".
That checkpoint starting: wal line is the smoking gun. It means this checkpoint was forced because WAL hit the limit, not because the timeout expired. A timed checkpoint would say checkpoint starting: time instead.
This is free forensic information. The logging overhead is negligible and provides a clear trail of checkpoint behavior. This is another one of those settings that should be enabled by default, and has been since Postgres 15. Those with older clusters will have to enable it manually.
Finding the Right max_wal_size
So should everyone just crank max_wal_size to some enormous value and forget about it? Not exactly. There are trade-offs.
A larger max_wal_size allows more WAL to accumulate between checkpoints, which means more data must be replayed during crash recovery. If Postgres crashes with 20GB of WAL to replay, startup necessarily takes longer than it would with 1GB. This difference in recovery time is usually only a matter of seconds, but it's worth acknowledging.
The other consideration is disk space. WAL files consume storage, and max_wal_size is a soft limit. Under heavy write loads, WAL can temporarily exceed it. There should be enough headroom on the WAL volume to accommodate bursts without running out of space entirely. That would be a much worse problem than slow checkpoints.
A reasonable starting point for write-heavy OLTP workloads is 10GB to 20GB. Systems with aggressive bulk loading or large batch operations might benefit from 50GB or more. The goal is to make forced checkpoints rare enough that essentially all checkpoints are timed and spread gracefully over checkpoint_completion_target.
We recommend validating the setting by monitoring pg_stat_checkpointer (or pg_stat_bgwriter) over time. Let the system run under typical load for a day or a week, then check the ratio. If requested checkpoints have increased, bump max_wal_size higher and repeat.
-- Reset stats and re-check after your observation window
SELECT pg_stat_reset_shared('checkpointer');

-- ... some time later ...
SELECT num_timed, num_requested FROM pg_stat_checkpointer;
If you'd rather not do this yourself, I actually wrote a Postgres extension called pg_walsizer. It launches a background worker that monitors checkpoint activity and automatically increases max_wal_size based on how many checkpoints occur within the configured checkpoint_timeout. Just set it and forget it!
Wrapping Up
Checkpoints are one of those Postgres internals that most people never think about until something goes wrong. Periodic latency spikes can have any number of causes after all. Not all DBAs consider checking WAL activity, nor realize the relationship it has with disk flushes—most people blame vacuum at first.
As is tradition, the default value of 1GB for max_wal_size is a conservative one. It minimizes crash recovery time and works fine for light workloads without using a lot of storage. Unfortunately, busy systems will quickly exceed this default and begin to suffer. Our test showed a 40% TPS plunge on modest hardware; production systems with heavier loads and tighter IO budgets will likely fare worse.
For most production environments, we suggest starting max_wal_size with something more appropriate. If log_checkpoints isn't already enabled, prioritize enabling that as well. And finally, either pg_stat_checkpointer or pg_stat_bgwriter should feature prominently in a monitoring dashboard. Look upon any increases in requested checkpoints with suspicion.
In the end, max_wal_size is one of those rare occasions where a single parameter can confer a substantial improvement with virtually no downside. So go check your checkpoint stats. You might be surprised by what you find!