Absorbing the Load
Recently on the pgsql-performance mailing list, a question popped up regarding a Top-N query gone wrong. On the surface, the query merely fetched the latest 1000 rows through a join involving a few CTEs in a dozen tables with a few million rows distributed among them. A daunting query with an equally daunting plan that required about 2-3 seconds of execution time. Not ideal, but not exactly a show-stopper either. But high concurrency compounded the problem, with 40 sessions enough to completely saturate the available CPU threads.
In the end all it took was a new index to solve the conundrum, as is usually the case with queries like this. Problem solved, right?
Well... maybe. But let's play a different game.
What if the query was already optimal? What if every join was fully indexed, the planner chose the most optimal variant, and yet the sheer volume of data meant two seconds was the fastest possible time? Now imagine not 40 concurrent users, but 4000. What happens then?
It's Just Math
Suppose a query takes two seconds after being fully optimized and there are 4000 users that each need that result once per page load, spread across a 60-second window. That's roughly 67 concurrent executions at any given moment. A 2-vCPU machine can only handle two of these, what about the other 65?
That's an irreducible capacity mismatch. If we can't reduce the execution time of the original query, we must provide some kind of substitution instead, one that reduces the number of times Postgres runs that query at all.
The good news is that Postgres has built-in tools for this. The better news is that there are external tools that extend those capabilities substantially. Sometimes—though a Postgres expert is loathe to admit it—the right answer rests outside of Postgres.
Let's explore the available tools.
It's a Material World
Postgres has supported materialized views since version 9.3, and they are exactly what they sound like: a view whose results are physically stored on disk, rather than recomputed on demand. Creating one is straightforward:
CREATE MATERIALIZED VIEW top_transactions AS
SELECT
    t.id,
    t.created_at,
    t.amount,
    a.account_name,
    s.status_label,
    -- ... additional joined columns
FROM transactions t
JOIN accounts a ON a.id = t.account_id
JOIN statuses s ON s.id = t.status_id
-- ... more joins
ORDER BY t.created_at DESC
LIMIT 1000;
Now instead of hammering the source tables on every request, thousands of concurrent users query a single pre-materialized result set. The read path becomes trivially fast. You can even add indexes to the materialized view itself:
CREATE INDEX idx_top_transactions_created ON top_transactions (created_at);The catch is that the data is frozen at the moment of last refresh. To update it, you run:
REFRESH MATERIALIZED VIEW top_transactions;By default, this takes an AccessExclusiveLock on the view during the refresh, meaning all reads are blocked until the operation completes. It's possible to refresh a materialized view concurrently, but this requires a unique index and is considerably slower:
REFRESH MATERIALIZED VIEW CONCURRENTLY top_transactions;It's typical to schedule such refreshes using a tool like pg_cron or an external scheduler:
-- With pg_cron installed
SELECT cron.schedule('refresh-top-transactions', '*/5 * * * *',
  'REFRESH MATERIALIZED VIEW CONCURRENTLY top_transactions');
What do we actually get here? Zero external dependencies, native Postgres, indexable, and queries like any other table. A multi-second query transforms into a sub-millisecond scan to clients. Unfortunately, the data is stale between refreshes, the concurrent refresh is slower and requires a unique index, a full refresh blocks all readers, and the refresh time scales with the base table size rather than the size of what actually changed. It's a blunt instrument, but an effective one.
Materialized views excel most when you can tolerate stale data on a predictable schedule. Think dashboards, reporting aggregates, and leaderboards where "as of 5 minutes ago" is perfectly acceptable. For real-time transactional Top-N results? Less so.
Can we improve on this?
Incrementally Yours
The pg_ivm extension addresses the core weakness of standard materialized views: the full recomputation on every refresh. IVM stands for Incremental View Maintenance, and the premise is straightforward. When a base table changes, only apply the delta to the materialized view, rather than rebuilding the entire thing from scratch.
The performance difference is striking; a full refresh of a large materialized view might take 20 seconds. An incremental update after a single-row insert may only require a few milliseconds. It's not uncommon to experience one or more orders of magnitude of improvement.
Creating an incrementally maintained materialized view (IMMV) looks like this:
SELECT create_immv(
  'top_transactions_live',
  'SELECT t.id, t.created_at, t.amount, a.account_name, s.status_label
   FROM transactions t
   JOIN accounts a ON a.id = t.account_id
   JOIN statuses s ON s.id = t.status_id'
);
Behind the scenes, pg_ivm attaches AFTER triggers to every base table referenced in the view definition. When a row is inserted, updated, or deleted in transactions, accounts, or statuses, those triggers fire and update top_transactions_live in the same transaction. The view is always current without any need for a job scheduler or update process.
-- After any INSERT/UPDATE/DELETE on base tables,
-- the view is immediately consistent
SELECT * FROM top_transactions_live
 ORDER BY created_at DESC
 LIMIT 10;
Beautiful. But there are some cracks in the facade.
Trigger overhead is real. Every write to every base table now carries a few microseconds of extra work. If those tables receive thousands of writes per second, every single one of those must update the IMMV. We've essentially traded faster reads for slightly slower writes. Whether that trade is favorable depends entirely on the database's read-to-write ratio and write latency thresholds.
There's also the matter of query restrictions. pg_ivm does not support HAVING, ORDER BY, LIMIT, window functions, UNION, or subqueries in the view definition. Notice that the LIMIT 1000 from the original view definition is missing and left as an exercise on the read side. Base tables must be plain tables too, not views, partitions, or foreign tables. And finally, data types need to support btree indexing, which rules out JSON, XML, and similar types.
The extension is best suited for aggregate-style views (sums, counts, averages) where the base data is relatively stable. For the specific Top-N use case from the mailing list, these limitations narrow its applicable scope considerably. But if your scenario fits within those constraints, the always-fresh guarantee is hard to ignore.
What other options are there?
Out of the Loop
Neither materialized views nor pg_ivm fully address highly dynamic real-time query results accessed by thousands of concurrent readers. The real insight is this:
The TTL of your cache only needs to be greater than or equal to the query execution time.
Think about that for a moment. A query with a two-second run-time has a minimum resolution of two seconds. By widening that window slightly to five seconds, cache refreshes can absorb slow executions while still remaining current. Every concurrent request in between just reads the cached result instantly, condensing thousands of database roundtrips into one.
This is the Shared Cache pattern, and it works at the application layer. The key design decision is to separate the writing of the cache from the reading of it. Rather than having client requests trigger the expensive query on a cache miss, you dedicate a background worker whose entire job is to keep the cache warm. Clients never touch the database directly, they only read from the cache.
Here's what something like that may look like in Python:
import time

CACHE_TTL = 5  # seconds, must be >= query execution time

# Background worker process: runs independently of client requests
def cache_refresh_worker(cache, query_configs):
    while True:
        for config in query_configs:
            cache_key = make_cache_key(config.filters)
            result = db.execute(config.query, config.filters)
            cache.set(cache_key, result, ttl=CACHE_TTL)
        time.sleep(CACHE_TTL)

# Client request handler: reads only, never queries Postgres
def get_top_transactions(user_filters):
    cache_key = make_cache_key(user_filters)
    return cache.get(cache_key)
This separation is what makes the pattern so effective. The background worker runs on its own schedule, executing the expensive query once per TTL cycle regardless of whether 1 user or 4000 users are waiting for results. The clients are completely decoupled from the database. There's no risk of a sudden surge of users all triggering the same expensive query at once, because clients never trigger it in the first place. The worker owns the query. The clients own the read. Those two concerns never intersect.
The dance is entirely agnostic to what Postgres is doing. No schema changes, no extensions, no triggers. And with a TTL measured in seconds rather than minutes, the data is effectively real-time from a user's perspective. Unless it's a high-frequency trading platform, few users will notice data that's a few seconds stale.
The obvious question is: where does this cache live? If it lives in-process memory, each application server maintains its own cache, and you still get N database queries for N application servers. Which brings us to the next stop on our tour.
The Shared Nothing Problem
Redis (and variants like KeyDB) is the most common answer to the shared cache problem in production environments. It's fast, simple, and provides a single cache shared by all application servers. That last part is important because it instantly solves the multi-instance cache coherence problem.
The same background worker pattern applies, but now the worker writes to Redis instead of a local dictionary, and every application server reads from the same shared store.
Let's see that with some more pseudo-python:
import redis
import json
import hashlib
import time

r = redis.Redis(host='localhost', port=6379, db=0)
CACHE_TTL = 5  # seconds

# Background worker: one instance, keeps Redis warm
def cache_refresh_worker(query_configs):
    while True:
        for config in query_configs:
            cache_key = "top_txn:" + hashlib.md5(
                json.dumps(config.filters, sort_keys=True).encode()
            ).hexdigest()
            result = db.execute(config.query, config.filters)
            r.setex(cache_key, CACHE_TTL, json.dumps(result))
        time.sleep(CACHE_TTL)

# Client request handler: any app server, reads only
def get_top_transactions(user_filters):
    cache_key = "top_txn:" + hashlib.md5(
        json.dumps(user_filters, sort_keys=True).encode()
    ).hexdigest()
    cached = r.get(cache_key)
    if cached:
        return json.loads(cached)
    return None  # cache not yet warm, or unknown filter set
Redis handles the TTL natively via SETEX, so even if the worker hiccups, stale entries expire on their own. The result: one database round-trip per refresh cycle, regardless of how many application servers or concurrent users there are. The worker is the only thing that ever talks to Postgres for these queries, and it does so at a calm, predictable cadence.
There are some things worth considering though. JSON serialization of large result sets has a cost. For very large payloads, MessagePack or Protocol Buffers will do the job with less overhead. Cache granularity matters too; if every user has a highly unique set of filter predicates, cache hit rate plummets and essentially negates any previous benefit.
Then of course there's cache invalidation. We can actually ignore that for the purposes of this discussion. Why? It's often better to have some data than no data. If the worker hasn't refreshed the cache, either the database is unreachable, or the refresh took longer than expected. In that event, the front end can display the existing cache with a tooltip or some other disclaimer disclosing the information may be slightly stale. While not ideal, the alternative is redirecting traffic back to the database, inevitably overwhelming its resources and resulting in no data for anyone.
Tools like Memcached deserve a brief mention as well. It's a reasonable alternative when you don't need persistence or data structures beyond simple key-value storage. It's slightly faster at raw cache operations but lacks many of Redis's operational niceties. It does the job in a pinch.
Pushing It to the Edge
If your Top-N query results are not user-specific (think a public leaderboard, a global trending list, or a site-wide feed) then there's one more powerful option that lives even further from Postgres: a Content Delivery Network (CDN).
CDNs like Cloudflare, Fastly, and AWS CloudFront can cache HTTP responses at edge nodes geographically close to your users. A CDN will cache the partial or fully-rendered results from a properly configured API endpoint with an appropriate Cache-Control HTTP header:
Cache-Control: public, max-age=5, stale-while-revalidate=10This instructs the CDN to serve the cached response for 5 seconds, and then for a further 10 seconds serve the stale result while asynchronously revalidating in the background. Your origin server, and by extension Postgres, sees one request per cache expiration cycle per CDN edge node. That could collapse millions of user requests into dozens of origin requests for global deployments.
The CDN approach follows the same philosophy as the background worker pattern, just at a different layer. The CDN itself handles revalidation, fetching a fresh copy from the origin on its own schedule rather than letting every user request pass through. It's elegant, requires zero application code changes for HTTP-based APIs, and the cost is typically a fraction of your dedicated compute resources.
The limitation, of course, is that CDN caching only applies to public data. Anything that varies by authenticated user (personalized feeds, account-specific results, user-filtered Top-N queries) can't be cached at the CDN layer without significant complexity involving headers, cache partitioning, or edge authentication. For those cases, intermediate caches like Redis remain a simpler solution.
There's also Varnish, which deserves a mention for teams that want CDN-like caching on self-hosted infrastructure. Varnish sits in front of an application server and caches responses based on configurable rules. It's extremely fast, delivers fine-grained control over cache behavior, and avoids CDN cost overhead.
That makes three different tiers of caching!
Know Your Terrain
There's no universal answer, but the decision isn't all that complicated:
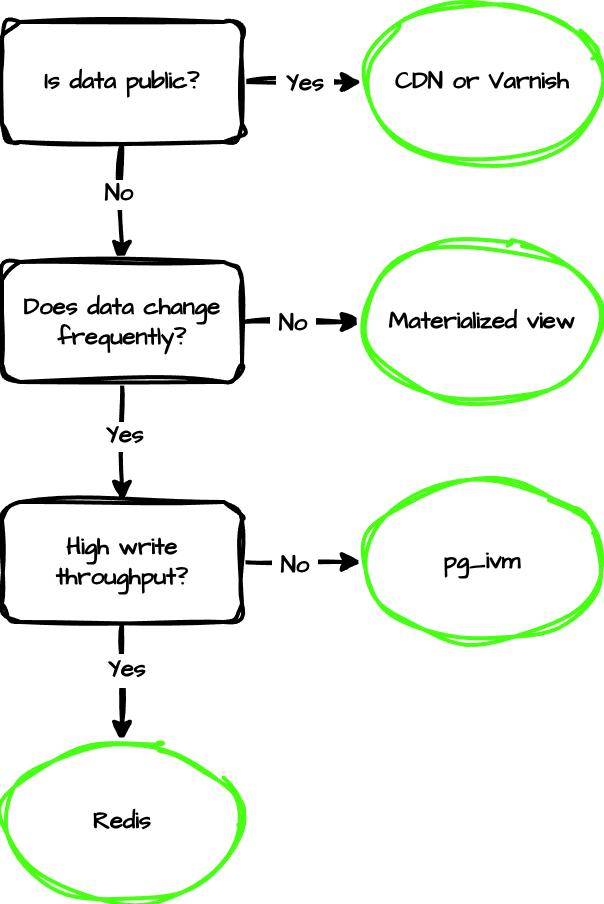 In practice, most high-scale systems use multiple layers simultaneously. Postgres materialized views pre-aggregate data that rarely changes. Redis caches user-specific query results with short TTLs. A CDN handles public-facing endpoints. Each layer absorbs load that doesn't need to reach the next one, and Postgres ends up only seeing the requests that genuinely require fresh database access.
| Strategy | Freshness | Write Overhead | Complexity | Best For |
|---|---|---|---|---|
| Materialized view | Minutes | None | Low | Aggregates, reporting |
| pg_ivm | Real-time | High (triggers) | Medium | Low-write aggregate views |
| Shared in-process cache | Seconds | None | Low | Single-server apps |
| Redis /Memcached | Seconds | None | Medium | Multi-server, user-specific data |
| CDN / Varnish | Seconds | None | Low | Public APIs, global scale |
Sometimes the Question Isn't the Question
Ostensibly, Yudhi asked about query tuning. Most of the early replies focused on missing indexes, and they were ultimately proven correct. A well-placed CREATE INDEX moderately improved that specific query. But that's not how every story ends.
What about the other questions Yudhi asked? The ones about thousands of concurrent users, CPU spikes, and capacity planning? Those are really architectural questions in query-tuning suits. Answering those questions evades any amount of database or query performance tuning.
When you've done everything right in Postgres (optimal queries, correct indexes, well-chosen configuration) and you still have more demand than your instance can absorb, the solution isn't to make the query faster. It's to make the query happen less often. Materialized views bestow that capability natively. The pg_ivm extension adds a few more bells and whistles in exchange for minor write throughput. Redis brings a shared cache that spans the entire application fleet. CDNs push the cache to the edge of the internet itself.
The magic, if we can call it that, is the layering. Each level absorbs the load that doesn't need to penetrate further. By the time a request actually reaches Postgres and runs a query, it genuinely needs to. Everything else was handled or deflected by an upstream layer.
I suspect most performance problems that look unsolvable at the query level are really just missing a layer. People don't usually think like databases, and really, who can blame them? But the next time you find yourself staring at a perfectly optimized query that still can't keep up with demand, consider: you may not have a query problem, but an architectural one. And the good news is that the solutions are well-understood, battle-tested, and surprisingly straightforward to implement.
Now go add that index. Then think about the cache. Your database will thank you.